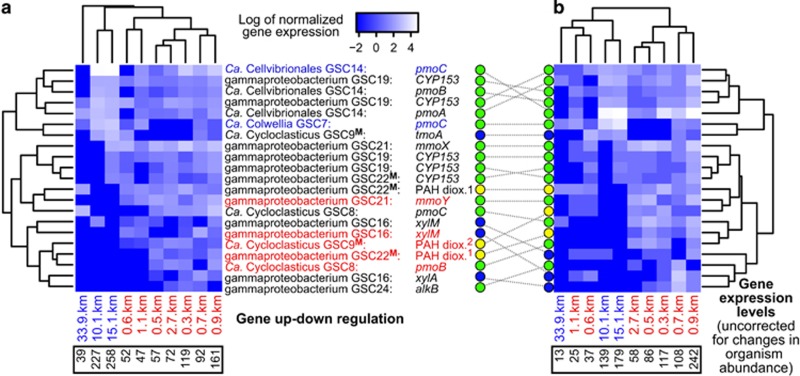
Figure 5.
Spatial expression profiles of genes associated with hydrocarbon degradation: (a) genome bin coverage corrected values, and (b) coverage uncorrected values. Heatmap rows and columns are unscaled. Genome bin and gene identities are given for each row. Significantly differentially expressed genes at proximal locations are in red, and those at distal locations are in blue. Bins marked with a bolded superscript ‘M’ expressed genes encoding different proteins (that is, putative multi-tasking bacteria). PAH dioxygenases (dioxy.) are large subunits resembling 1naphthalene or 2anthranilate/(ortho-halo)benzoate dioxygenases. Circles indicate hydrocarbon classes targeted by genes: green=alkane; blue=aromatic; yellow=PAH. Lower black boxes contain sums of (a) RPKAC and (b) RPKA values per site.

