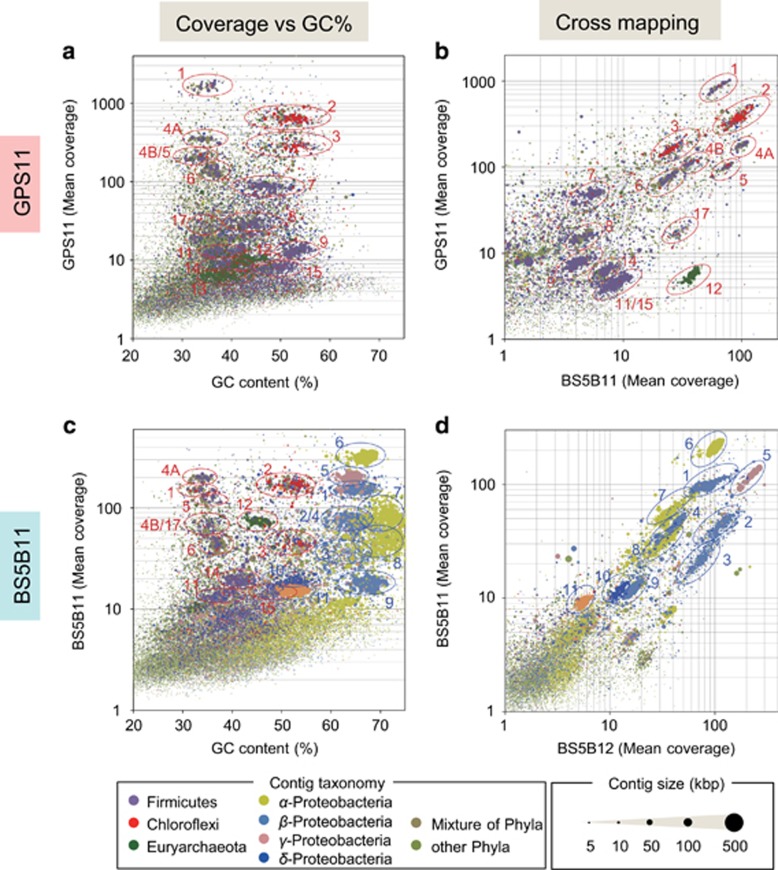
Figure 2.
Genome clustering from the assembled contigs of metagenomic sequences of The Cedars springs GPS1 and BS5. Samples collected from GPS1 and BS5 in 2011 are shown as GPS11 or BS5B11, respectively. Colored circles indicate clusters of individual bin-genomes. Bin-genomes were identified using the estimated taxonomic classification (color of dots), length (size of dots), GC content and mean coverage of contigs. Colors for the circles denote groundwater sources where the bin-genomes are associated, that is, red circles show the deep members, while blue circles show the shallow member. Numbers/letters shown near the circles correspond to the bin-genome IDs in (a). (a and c) Clustering based on the mean coverage versus GC% plot. (b) Clustering for the members of deep groundwater based on coverage differences between the two springs. (d) Clustering for the members of shallow groundwater based on the coverage differences of 2 years’ metagenomes.

