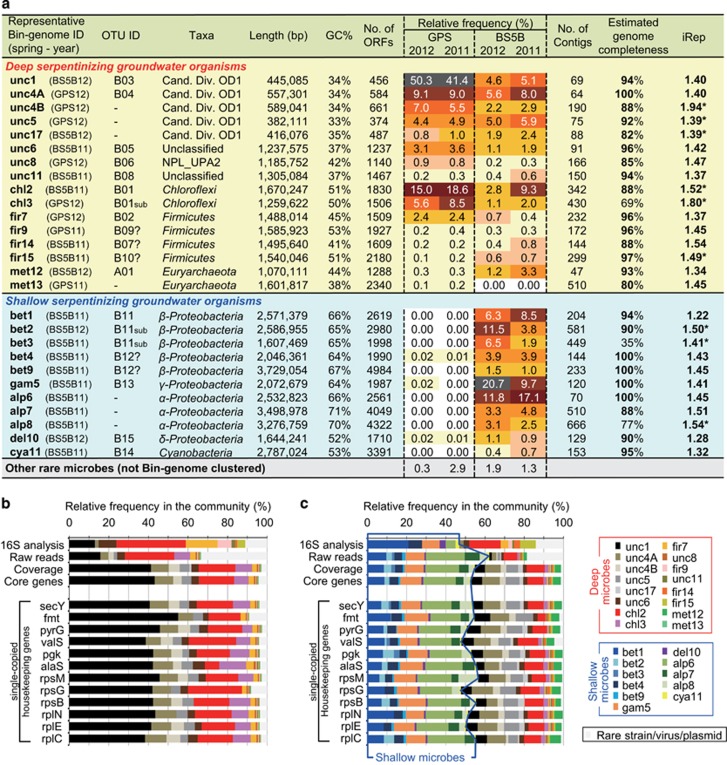
Figure 3.
Overview of genome recovery. (a) Genomic features of representative bin-genomes of OCS. Completeness was estimated as fraction of the number of identified and the number of expected core genes within the phylogenies. Values of the iRep infer microbial population replication rates. *The number shows unfiltered iRep value. (b and c) Relative frequencies of each OCS within GPS11 (b) and BS5B11 (c) estimated from a relative abundance of 16S rRNA gene (16S analysis), percentage of mapped raw reads to each bin-genome (Raw reads), an average value of reads per kilobase per million mapped reads (RPKMs) of each bin-genome (Coverage), an average RPKM value of 12 single-copied housekeeping genes (Core genes) and an RPKM value of 12 individual single-copied housekeeping genes.

