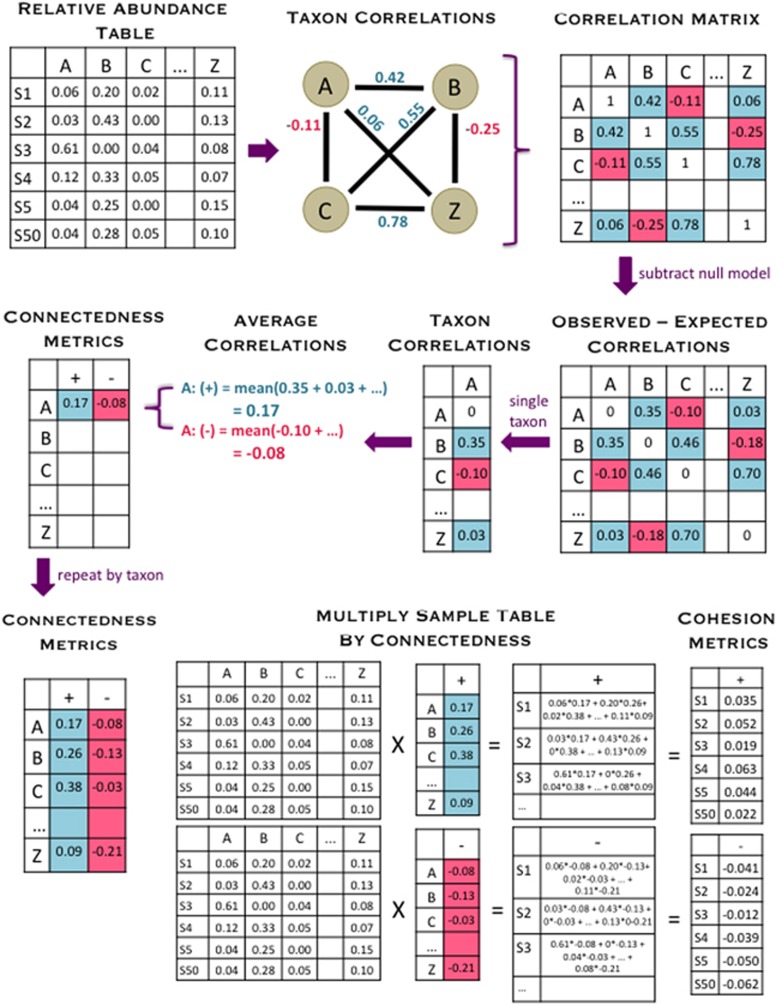
Figure 1.
This diagram shows an overview of how our cohesion metrics are calculated, beginning with the relative abundance table and ending with the cohesion values. The relative abundance table shows six samples (S1 indicating ‘Sample 1’ and so on) and a subset of taxa (A, B, C and Z). First, pairwise correlations are calculated between all taxa, which are entered into the correlation matrix. We then used a null model to account for how the features of microbial data sets might affect correlations, and we subtracted off these values (null model detailed in Figure 2). For each taxon, we averaged the positive and negative corrected correlations separately and recorded these values as the positive and negative connectedness values. Cohesion values were obtained by multiplying the relative abundance table by the connectedness values. Thus, there are two metrics of cohesion, corresponding to positive and negative values.

