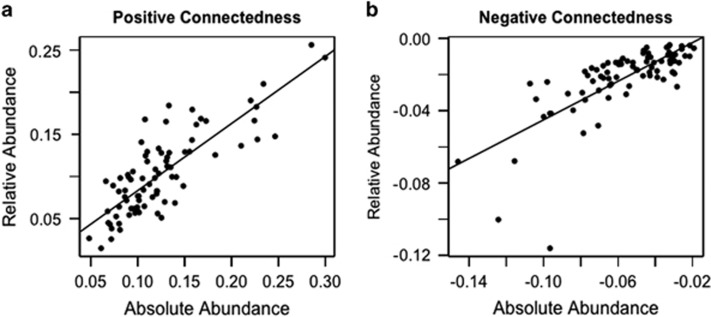
Figure 3.
Comparing the metrics of connectedness obtained from the absolute abundance data set (x axes) and the relative abundance data set (y axes) shows agreement between the two methods of generating these metrics. Correlations between the metrics are 0.810 (a) and 0.741 (b). We used separate variables for positive and negative metrics because relativizing the data set is expected to differentially affect positive and negative correlations. Solid lines show the fit of linear models.

