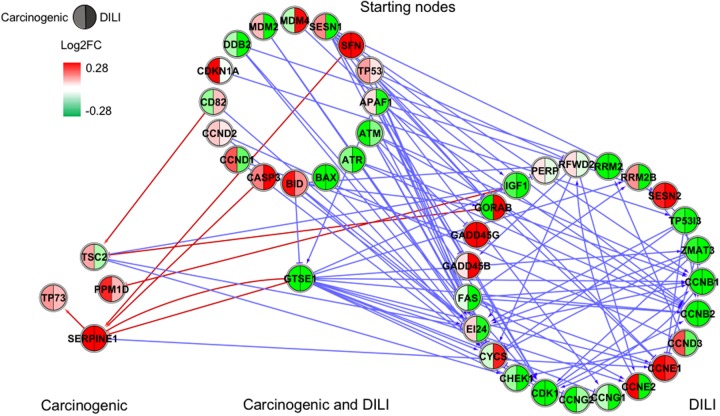
FIGURE 4.
Gene regulatory network (GRN) inferred for members from the TP53 pathway. Red-colored edges: interactions predicted for carcinogenic group; Blue-colored edges: interactions predicted for drug-induced liver injury (DILI) group. Cluster in the upper section indicate starting nodes, while clusters in the lower section are comprised of target genes specific to each chemical group.

