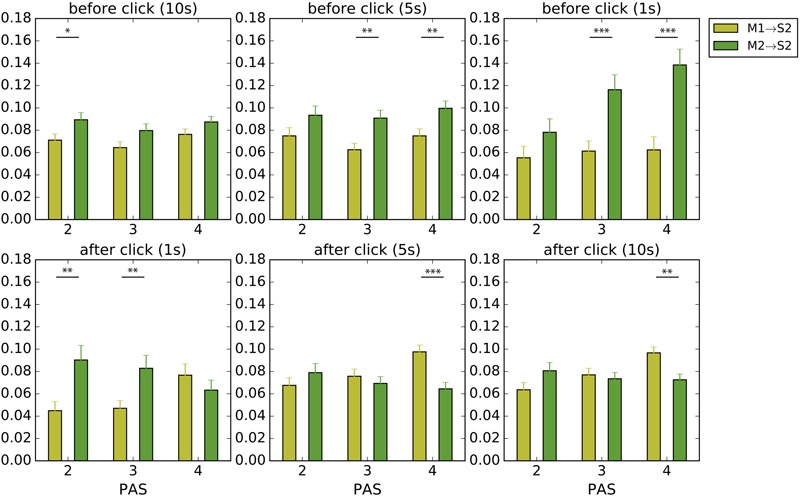
FIGURE 9.

Average local TE to the other’s sensations before and after clicks. We analyzed periods of 10, 5, and 1 s before a click and 1, 5, and 10 s after a click. Yellow and green bars indicate how much the movements made by the self (M1), i.e., the player who made the click, and by the other player (M2) contributed to the other’s tactile stimulation (S2), respectively. Error bars represent standard error; significance was calculated using the Welch’s t-test. ∗p < 0.05, ∗∗p < 0.01, ∗∗∗p < 0.001.
