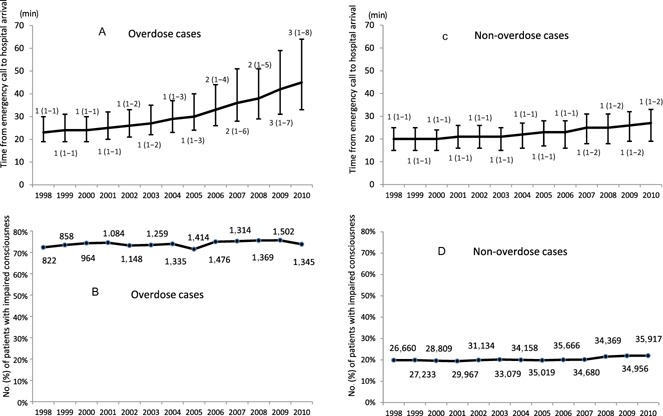
Figure 2.

Annual trend for time factors concerning emergency patients transported to hospital by ambulance in Osaka City, Japan, 1998–2010. In overdose cases, time periods from emergency call to hospital arrival were markedly increased (P < 0.0001 for trend). The number of hospitals to which the emergency medical service crew made contact for each patient is labeled as the median (quartiles) (A). Although in non‐overdose cases time periods from emergency call to hospital arrival were increased (P < 0.0001), the increase was not accelerated compared to overdose cases. The number of hospitals to which the emergency medical service crew made contact is labeled as the median (quartiles) (C). Numbers and percentages of patients whose consciousness was impaired are shown in overdose cases (B) and non‐overdose cases (D).
