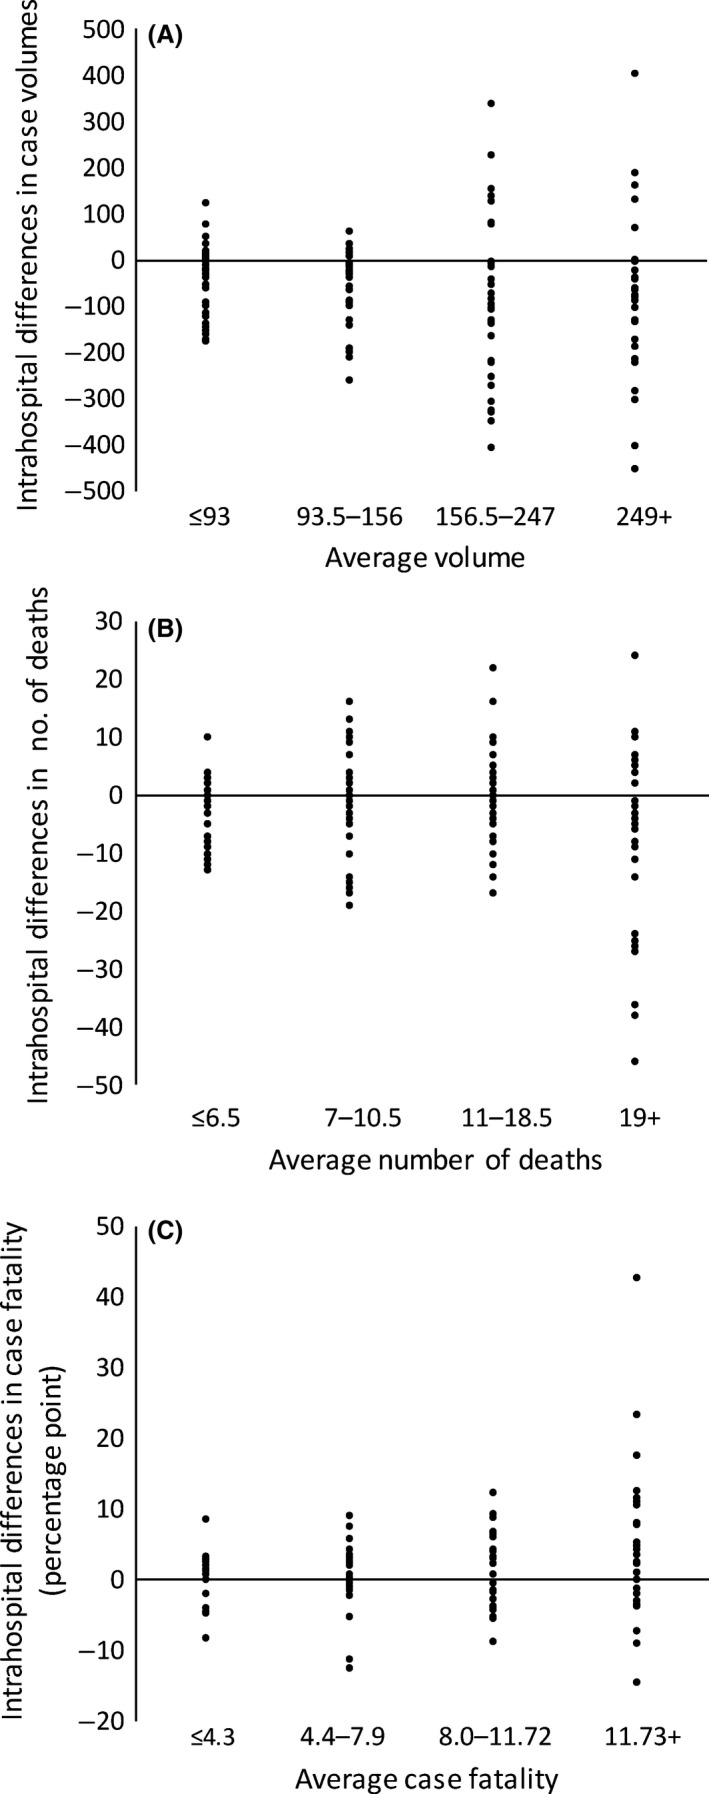
Figure 2.

Intrahospital differences in case volumes, number of deaths, and case fatality rates between data from the Japan Trauma Data Bank and annual hospital evaluations by the Ministry of Health, Labour and Welfare. The Y‐axes indicate intrahospital differences and the X‐axes indicate the average of the two values by quartile for case volumes (A), number of deaths (B), and case fatality rates (C).
