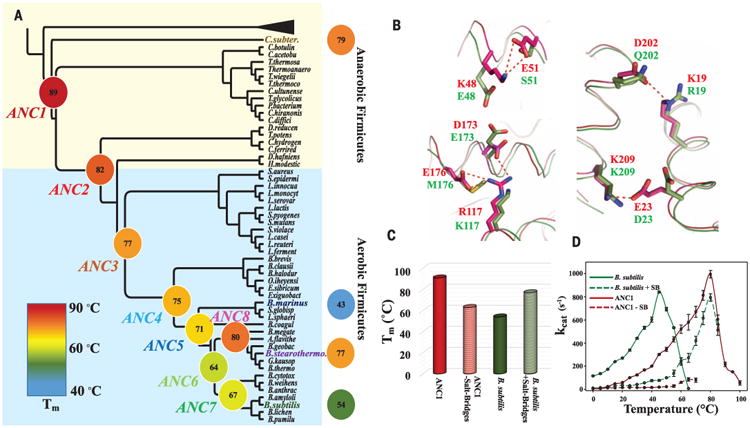
Fig. 2. Evolution of thermostability through the reconstructed Adk phylogeny spanning 2.5 to 3 bya.

(A) Collapsed cladogram of the tree (see fig. S1) used to resurrect ancestral Adks (nomenclature and colors for the 12 Adks are used throughout the manuscript). Measured Tms are indicated and illustrated by a continuous color scale. (B) Superposition of ANC1 (red, 5G3Y) and B. subtilis Adk (green, 1P3J) structures suggests salt bridges (dotted red lines) in ANC1 responsible for high Tm. (C) Removing these salt bridges from ANC1 or adding them into B. subtilis results in a drastic decrease or increase in Tm, respectively. (D) Corresponding activity changes of these mutant proteins. Errors are standard errors from the linear fit based on eight time points for each temperature.
