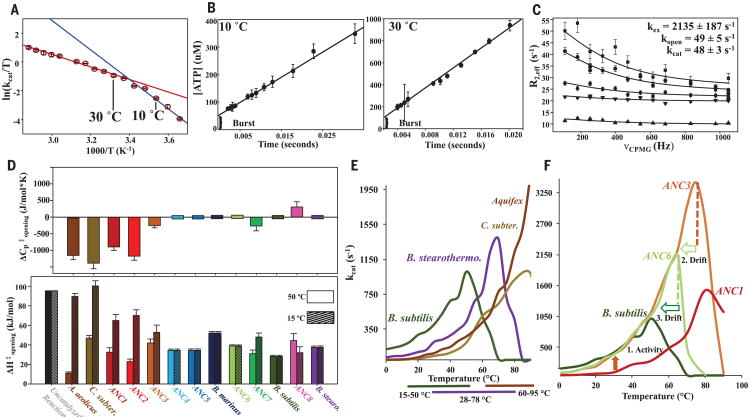
Fig. 4. Change in as evolutionary driver for thermoadaptation of catalysis and implications for organismal fitness.
(A) Eyring plot of ANC1 activity with theoretical explanation of curvature caused by a change in rate-limiting step between 10° and 30°C between two steps with different temperature dependencies (red and blue lines). (B) Quench-flow experiment of 100 μM ANC1 and 5 mM Mg/ADP shows a burst for fast phosphoryl transfer, followed by the rate-limiting lid opening (linear part) (mean ± SEM; N = 3 experiments). (C) 15N CPMG relaxation (22) data of representative residues of ANC1 during catalysis at saturating concentrations of Mg/ADP at 15°C. Error bars denote uncertainty in the ratio of cross-peaks, estimated as root mean square deviation from duplicates. (D) Heat capacity of activation for lid-opening dynamics ( ) for all Adk enzymes determined from the data of Fig. 3 fitted to Eq. 1 (top) and corresponding ΔH‡ values at 50° and 15°C (bottom) (standard errors in the fitted parameters). (E) Correlation between activity–temperature profiles of modern Adks with their known growth temperatures (35–38) (bottom bars). (F) Activity–temperature profiles along the evolutionary path from ANC1 to modern B. subtilis labeling active pressure for increased activity at lower temperatures (orange arrow from ANC1 to ANC3), creating a hyperactive and hyperstable enzyme in ANC3 and subsequently a slower passive drift to decreased stabilities via ANC6 to B. subtilis (light green and green open arrow).

