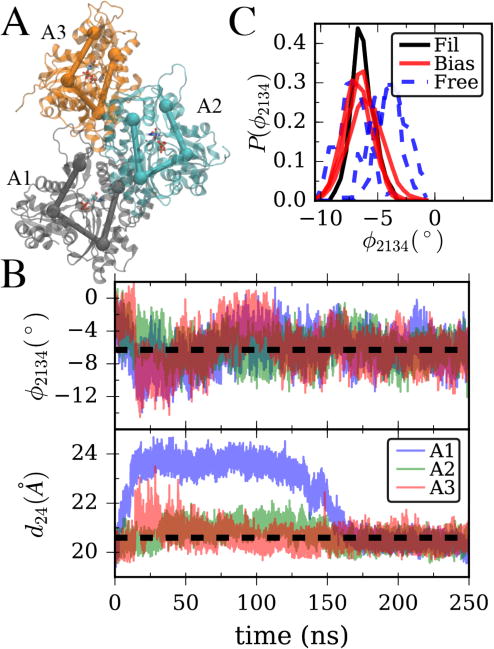
Figure 5.

(A) Illustration of all-atom three actin sub-filament with CG subdomains from Figure 1A overlaid. (B) Twist angle and cleft distance for each of the subunits in (A) during LM bias simulation. (C) Observed distribution of twist angles in the final 50ns of an unbiased 100ns simulation of the structure in (A) (dashed line) vs. the final 50ns of the biased simulation with data plotted in (B) and the final 50 ns of filament data from Figure 1B.
