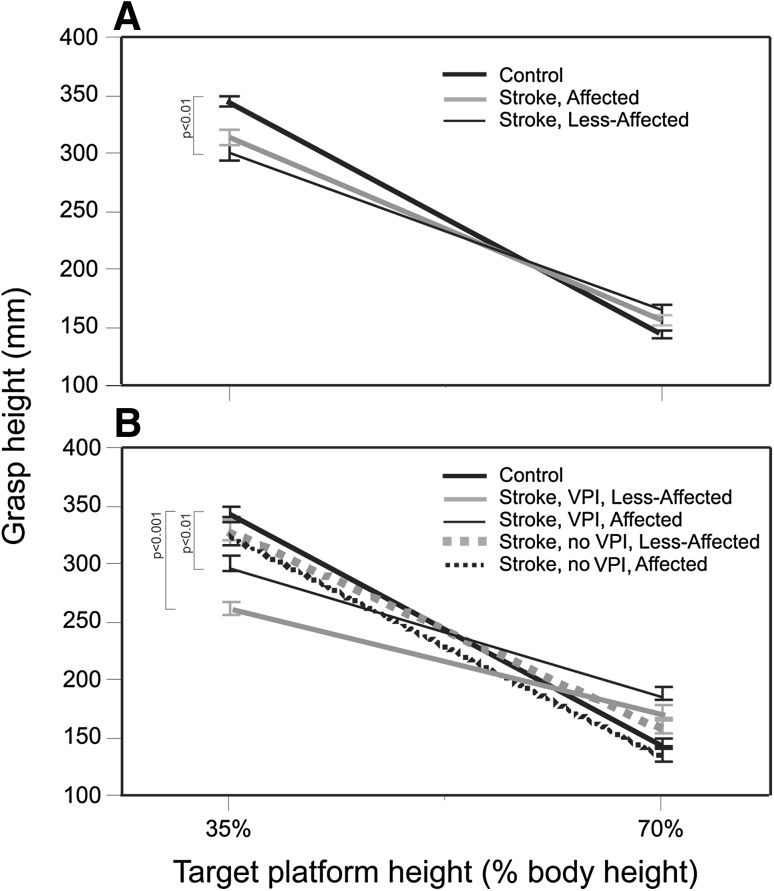
Fig. 3.
Linear relationships, plotted as slopes, of grasp height values for 35 and 70% target platform heights for a the less-affected (n = 17) and affected (n = 17) arms of subjects with stroke, and for b subgroups of stroke subjects with (VPI, n = 7) and without visuo-perceptual impairment (no VPI, n = 10) together with the left arm of healthy controls (control, n = 17). Significant differences between stroke groups/subgroups compared to controls are indicated

