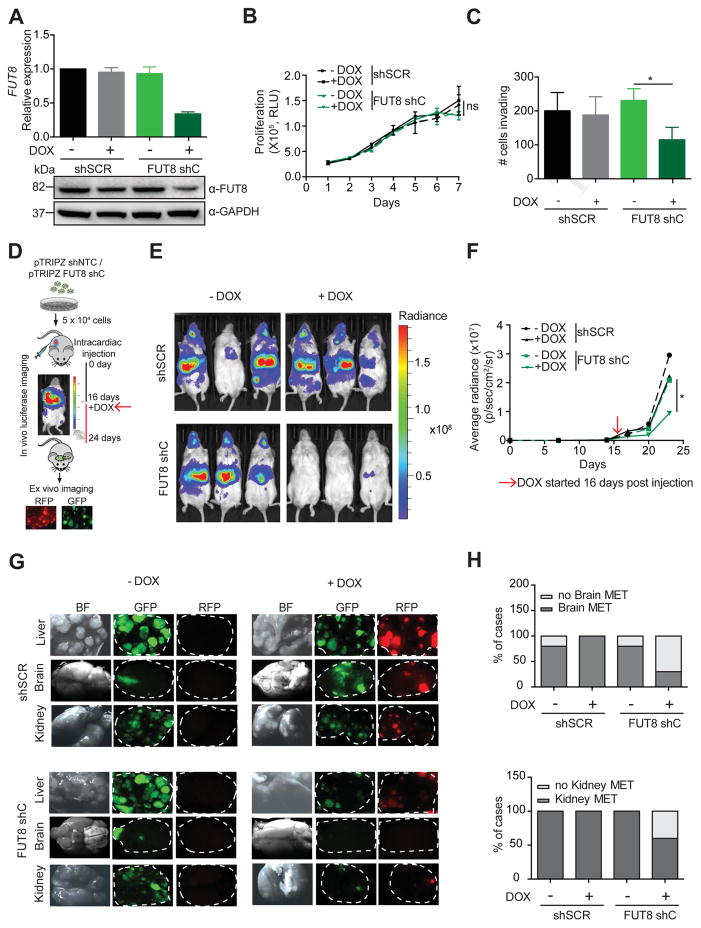
Figure 4. FUT8 silencing impairs the growth of established metastasis in vivo.
(A) Real-time qPCR and Western blot of FUT8 levels in 4L melanoma cells stably transduced with DOX inducible pTRIPZ-shSCR or pTRIPZ-FUT8 shC. QPCR graph shows average relative expression normalized to GAPDH, 3 replicates per condition. Data shown is representative of three independent experiments. (B) Cell proliferation assay of FUT8 shC or shSCR-transduced 4L cells in the presence (1 μg/ml) or absence of DOX. Cell growth was analyzed by Cell Titer Glo, 3 replicates per condition. Data shown is representative of two independent experiments. (C) Number of FUT8 shC or shSCR-transduced 4L cells that invaded into the basal side of matrigel-coated trans-well inserts after 36 hr. n=5 fields per replicate; 3 replicates per condition. Data shown is representative of three independent experiments. (D) Schematic representation of the in vivo metastasis assay with 4L melanoma cells stably transduced with DOX inducible pTRIPZ-shSCR or pTRIPZ-FUT8 shC instilled by intracardiac injection into NSG mice (n=4 mice per group in –DOX and + DOX shSCR, n=9 mice per group in –DOX and + DOX FUT8 shC). (E) Representative images of whole-body in vivo imaging 12 days post DOX treatment. (F) Average radiance after intracardiac injection of 4L cells followed over time. DOX treatment was started 16 days post injection. (G) Ex vivo fluorescent microscopic images of mouse liver, kidney and brain metastases at termination of the experiment. White dotted ovals mark organs. (H) Histogram shows the percentage of mice that developed brain or kidney metastases in each group of mice. Data are presented as mean ± SD in A, B and C. Two-tailed unpaired t test. *p=0.01 to 0.05, ns: not significant.

