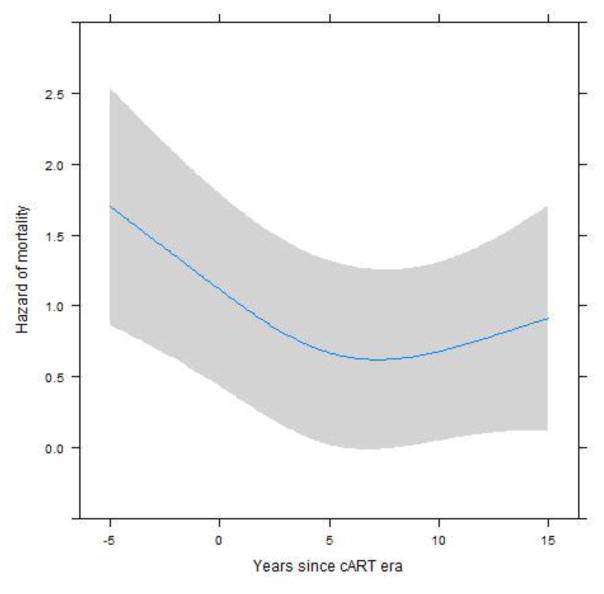
Figure 2.
Adjusted model for mortality risk over time since the beginning of the cART era.
Note: plot adjusted for these values: site=Brazil, Age=20 years, gender=male, Transmission route=Homosexual, CD4 count=50cells/mm3, and CM after ART initiation. Year 0 in x-axis marks the beginning of the cART era.
This figure represents the association between mortality and time from a patient’s CM diagnosis to the year that cART was introduced at the patient’s study site. The highest mortality was observed among patients diagnosed with CM before the introduction of cART; mortality declines in the cART era, although there is a plateau in mortality in later years of the cART era.

