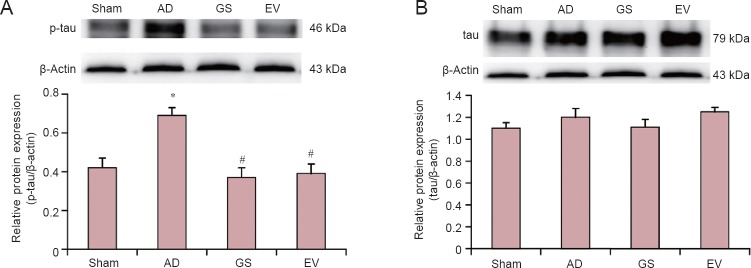
Figure 3.
Changes in p-tau and tau protein expression levels in the hippocampus of AD rats under GS treatment.
(A, B) p-tau and tau protein expression in the hippocampus of AD rats under GS treatment. Results are the gray value ratio of target proteins and β-actin. *P < 0.01, vs. sham group; #P < 0.01, vs. AD group. Data are shown as the mean ± SD (n = 3, one-way analysis of variance and the least significant difference test). Sham: Sham-operated group (injected with normal saline, normal feed); AD: Alzheimer's disease group (intraperitoneal injection of D-galactose in combination with bilateral hippocampal injection of amyloid-β peptide (25–35), 0.5% sodium carboxymethyl cellulose); GS: genistein group (90 mg/kg GS); EV: estradiol valerate group (0.3 mg/kg EV). p-tau: Phosphorylated tau protein.

