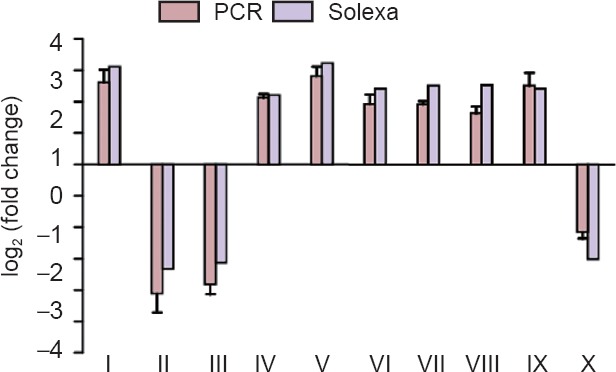
Figure 4.

qPCR analysis of 10 genes shown to be differentially expressed by Solexa sequencing.
PCR was performed on 10 genes randomly selected from differentially expressed genes identified by Solexa sequencing. Data are expressed as the mean ± SD (n = 4; one-way analysis of variance followed by Dunnett's t-test). Each data point represents the average from three tests, and error bars represent the standard deviations. Ftl1: Ferritin light chain 1; Cdk5r2: cyclin-dependent kinase 5 activator 2; Omg: oligodendrocyte-myelin glycoprotein; Mif: macrophage migration inhibitory factor; Uqcrh: ubiquinol-cytochrome c reductase hinge protein; Ncdn: neurochondrin; Syp: synaptophysin; Gstp1: glutathione S-transferase P; Tgfb3: transforming growth factor beta-3; Thbs1: thrombospondin-1. The experiment was repeated three times. qPCR: Quantitative polymerase chain reaction. I: Ftl1; II: Cdk5r2; III: Omg; IV: Mif; V: Uqcrh; VI: Ncdn; VII: Syp; VIII: Gstp1; IX: Tgfb3; X: Thbs1.
