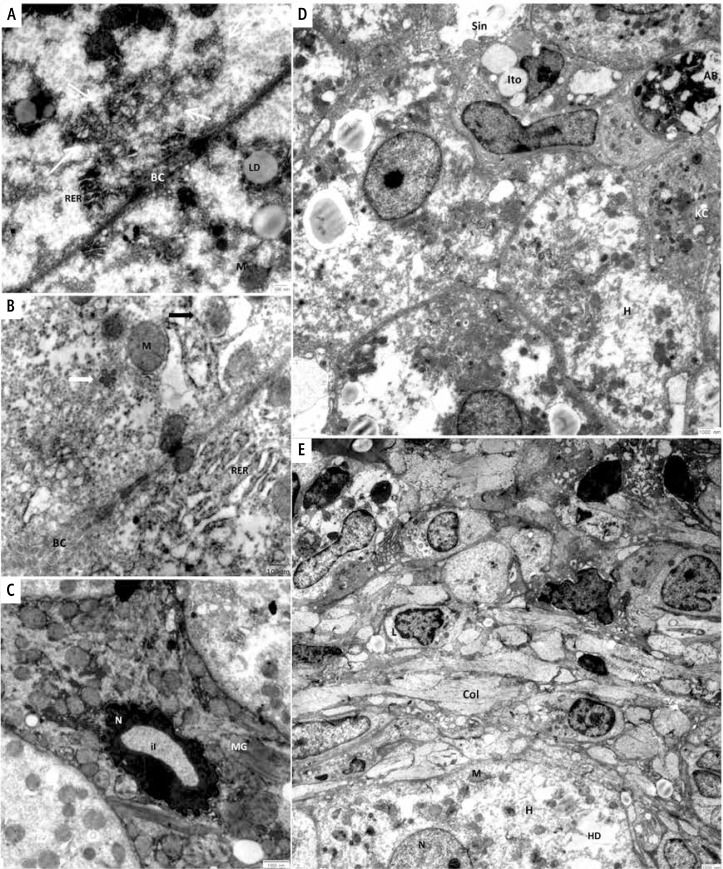
Fig. 5.
A) Interface between the two adjacent hepatocytes: membranous web (white arrows), M – mitochondria, RER – rough endoplasmic reticulum, BC – bile canaliculus, LD – lipid droplet; bar = 500 nm EM. B) A few virus-like particles (white arrows) lying free in the cytoplasm and cytoplasmic vesicle containing virus-like particles associated with amorphous material (black arrows); bar = 100 nm. C) Hepatocyte undergoing apoptosis (shrinkage necrosis, acidophilic degeneration): MG – megamitochondria; N – pyknotic nucleus, iI – Intranuclear inclusion; bar = 1000 nm. D) Hepatocytes of perivenular zone. Acidophilic body extruded from the liver cell plate into a sinusoid: Sin – sinusoid, AB – acidophilic body, Ito – Ito cell, KC – Kupffer cell, H – hepatocyte; bar = 1000 nm. E) The fragment of portal tract and interface between portal tract and parenchyma: H – hepatocyte, Col – the bundles of collagen fibers, L – lymphocyte, N – nucleus, M – mitochondria, HD – hydropic degeneration; bar = 1000 nm

