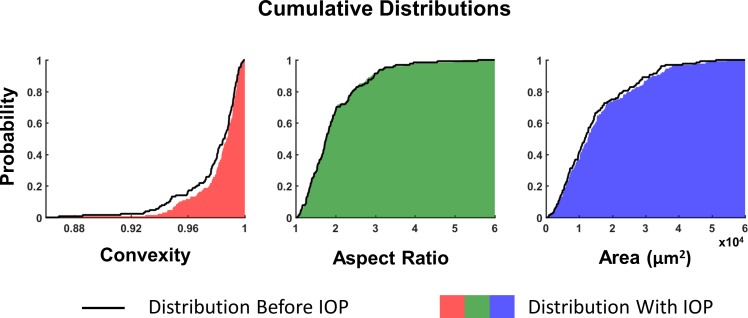
Figure 8.
The cumulative distribution of pore shape and size are shown in the initial condition (black line) and after elevated IOP (solid color). The rightward shift in the distribution of convexity indicates that the deformed pores are more convex after elevated IOP. The distribution of pore aspect ratios was largely unchanged by the increase in IOP. A slight rightward shift of the distribution of pore areas was observed highlighting the increase in pore area under elevated IOP.

