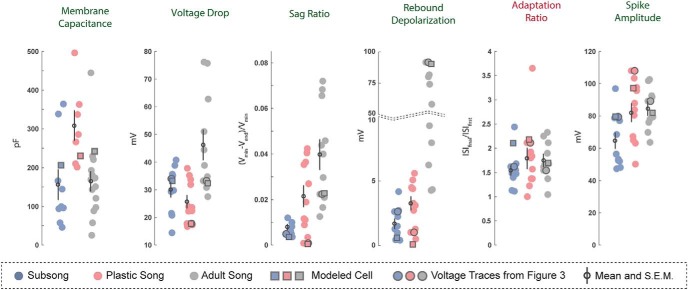
Figure 4.
Developmental changes in HVCx neurons. Each scatterplot depicts a physiologic feature of interest where each point represents measurement from a single neuron. Outlined circles represent features measured from the experimentaly recorded traces presented in Figure 3. Outlined squares indicate the measurments from the modeled traces presented in Figure 3. The means and SEMs are ploted over each data set. Legends for developmental changes that were statistically significant are indicated in green font while features that were developmentally stable are indicated in red.

