Figure 4.
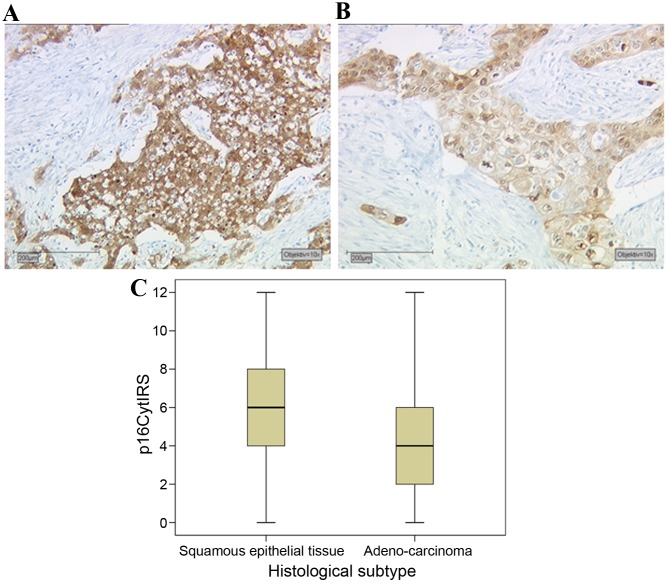
Expression of p16 in cervical cancer tissues (A) Squamous epithelial tissue demonstrated higher p16 expression levels compared with (B) adenocarcinoma tissue. (C) Box plot summary of the p16 IRS for each histological subtype. Scale bar, 200 µm. IRS, immunoreactive score; p16Cyt, cytoplasmic p16.

