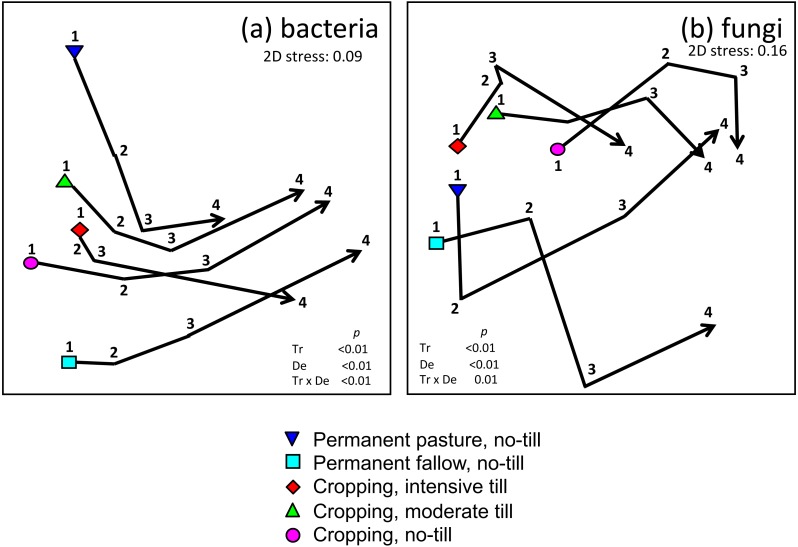
Figure 3. Non-metric multi-dimensional scaling plots of (A) bacteria; and, (B) fungi grouped according to treatment and sampling depth.
Impact of crop management on microbial community composition measured at different soil depths. Plots are non-metric multi-dimensional scaling plots of (A) bacterial; and, (B) fungal community data grouped according to treatments (triangle-down) Permanent pasture, (square) Permanent fallow, (diamond) Intensive tillage, (triangle-up) Moderate tillage, (circle) No-till. The scaling is based on a Bray–Curtis similarity matrix of ARISA profiles. The trajectory shows the movement of data points related to depth (1) 0–7.5 cm, (2) 7.5–15 cm, (3) 15–25 cm, (4) 25–30 cm for average data from each treatment. 2D stress values are 0.09 and 0.16 for bacterial and fungal data, respectively. The significance (PERMANOVA p values) of differences related to treatment (Tr), sample depth (De) and their interaction (Tr × De) are shown on each plot.

