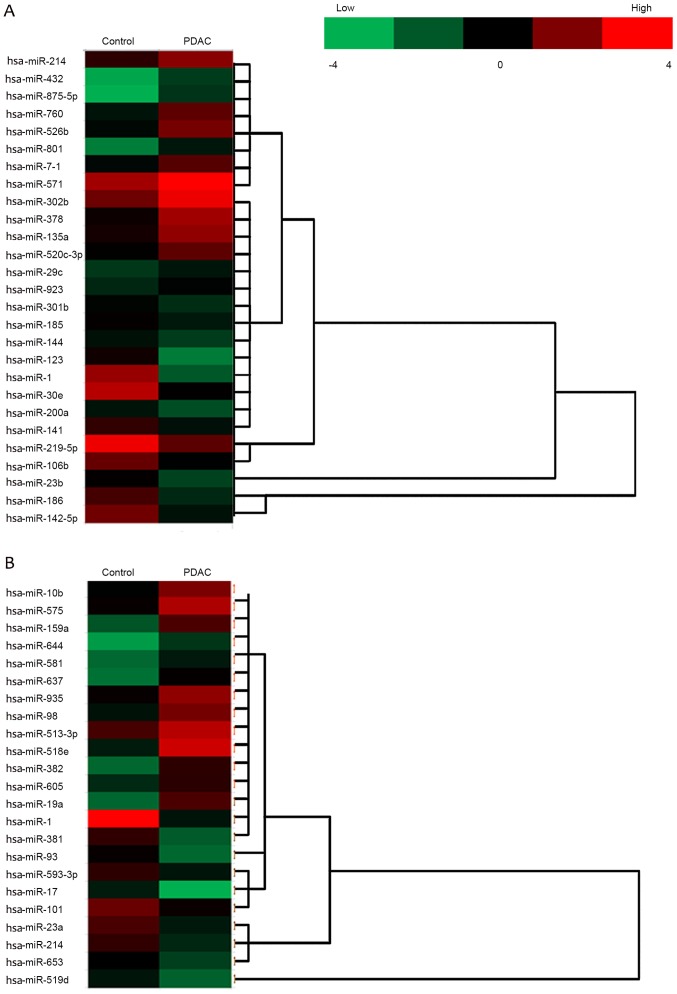
Figure 1.
miRNA analysis of sera and tumor samples between PDAC and healthy controls. The heat-map identifiesthe significant differentially expressed miRNAs. miRNA expression in paired sera of patients with PDAC with healthy controls and tumor tissuesfrom patients with PDAC with the adjacent normal tissues were profiled. Red and green colors represent high and low expression, respectively. (A) Sera. (B) Tumor. miR, microRNA; PDAC, pancreatic ductal adenocarcinoma; hsa, Homo sapiens.

