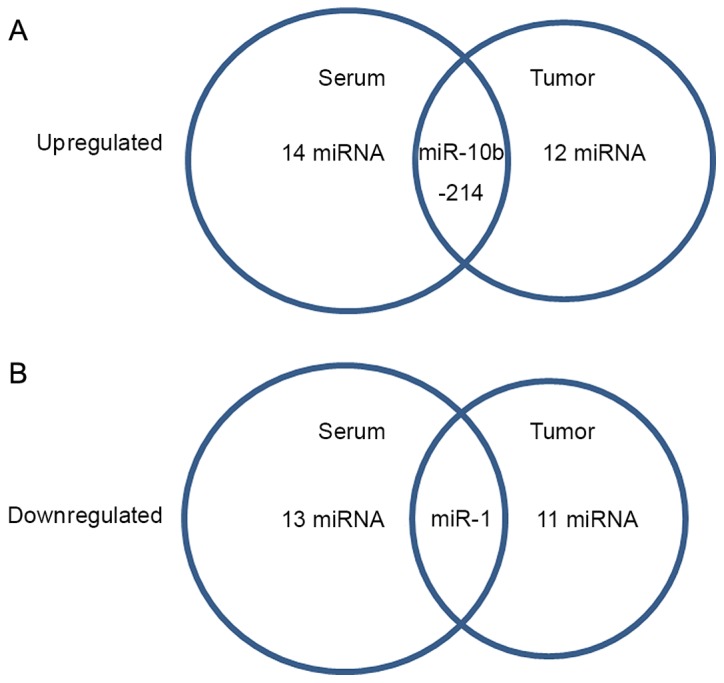
Figure 2.

Differential miRNAs between PDAC and control samples. (A) Sera samples. (B) Tumor samples. The diagram demonstrates that among the differential miRNAs between the pancreatic ductal adenocarcinoma and control groups, miR-1, miR-10b and miR-214 were different either in the sera or in the tumor tissue samples. miR, microRNA; PDAC, pancreatic ductal adenocarcinoma.
