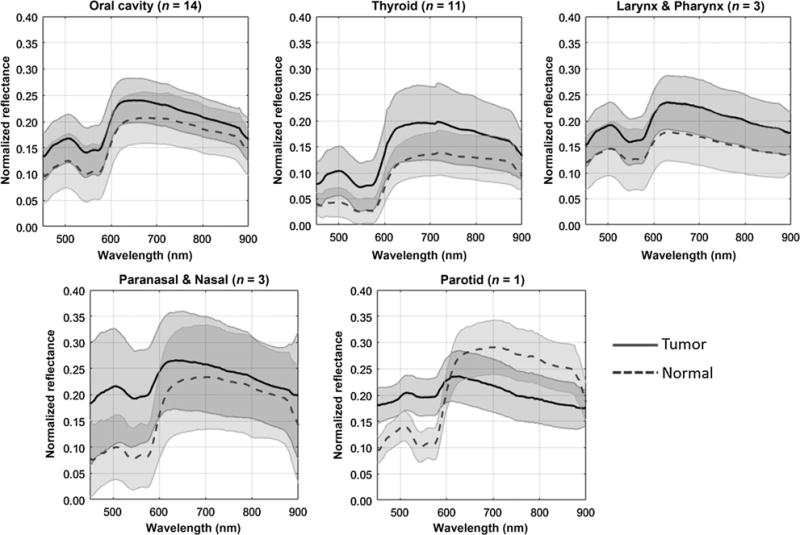
Figure 2.

Average spectral curve of tumor and normal tissue samples from various head and neck cancer sites, including the oral cavity, thyroid, larynx, pharynx, parotid, paranasal sinus, and nasal cavity of human patients. The solid line and dash line represent the mean spectra of cancer and normal tissue, and the shaded area centered on the two lines represents the standard deviation.
