Fig. 4.


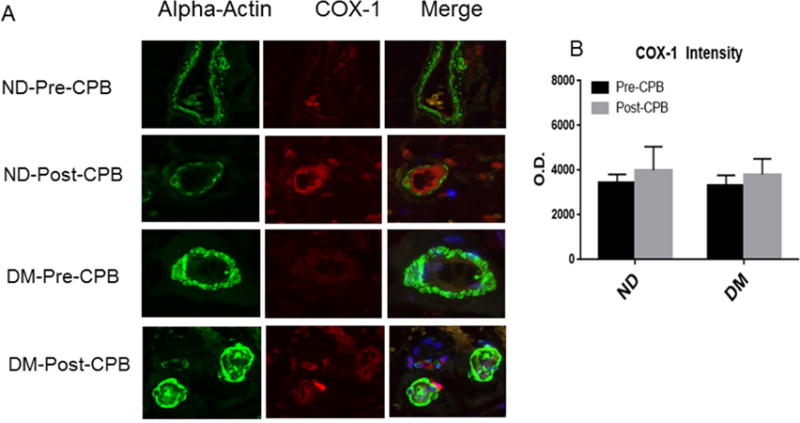
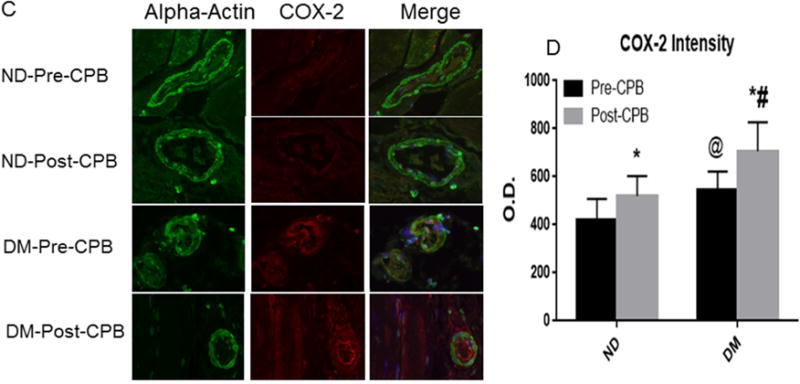
A, Immunofluorescence staining of COX-1 in paraffin-embedded human skeletal muscle tissue samples from ND and DM patients; Vessels were co-stained for cell nuclei (blue), smooth muscle α-actin (green) and COX-1 (red in endothelium and orange in smooth muscle). B, Densitometric analysis of signal intensities shows no significant differences in COX-1 distribution between the two groups or between pre- and post-CPB; C, Immuno-histochemical image of COX-2 in paraffin-embedded human skeletal muscle tissue samples from ND and DM patients; Vessels were co-stained for cell nuclei (blue), smooth muscle α-actin (green) and COX-2 (red in endothelium and orange in smooth muscle). D. Densitometric analysis of signal intensities shows differences in COX-2 distribution in the skeletal muscle arterioles between the two groups or between pre- and post-CPB; Data are means ± SEM, *p<0.05 vs. pre-CPB; @P<0.05 vs. ND at baseline, #P<0.05 vs. ND post-CPB; Data are means ± SD, n= 6/group.
