Figure 5.
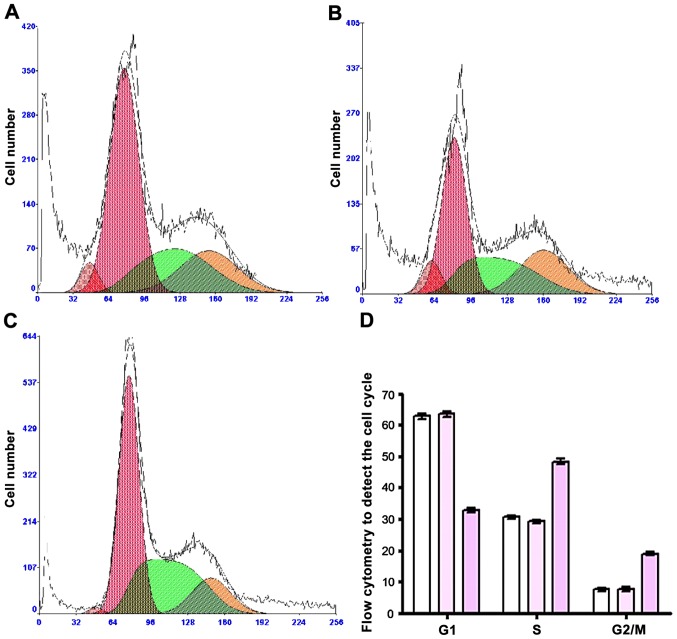
Flow cytometry was used to detect the cell cycle distribution. (A) Blank control group; (B) Negative control group; (C) FABP-5-shRNA group; (D) Quantitative analysis showed that the proportion of G1 phase cells in the FABP-5-shRNA group was reduced, while the proportions of cells in S phase and G2/M phase increased. FABP-5, fatty acid binding protein-5.

