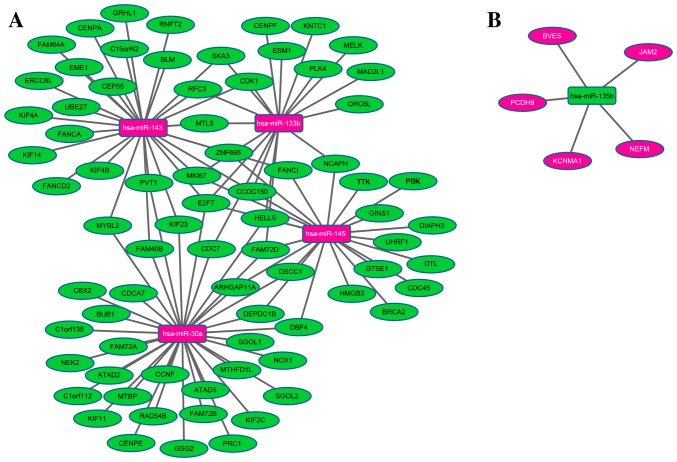
Figure 1.
Interaction networks showing DEmiRNAs associated with STAD survival time and their target genes that were differentially expressed in the present study. Interaction networks of (A) the upregulated miRNAs and their downregulated targets, and (B) the downregulated miRNA and its upregulated targets are shown. The central rectangular nodes represent miRNAs, and circular nodes represent target genes; green nodes represent downregulation in STAD, whereas pink nodes represent upregulation. Lines indicate an interaction between the miRNAs and an mRNA. DEmiRNAs, differentially expressed microRNAs; STAD, stomach adenocarcinoma.

