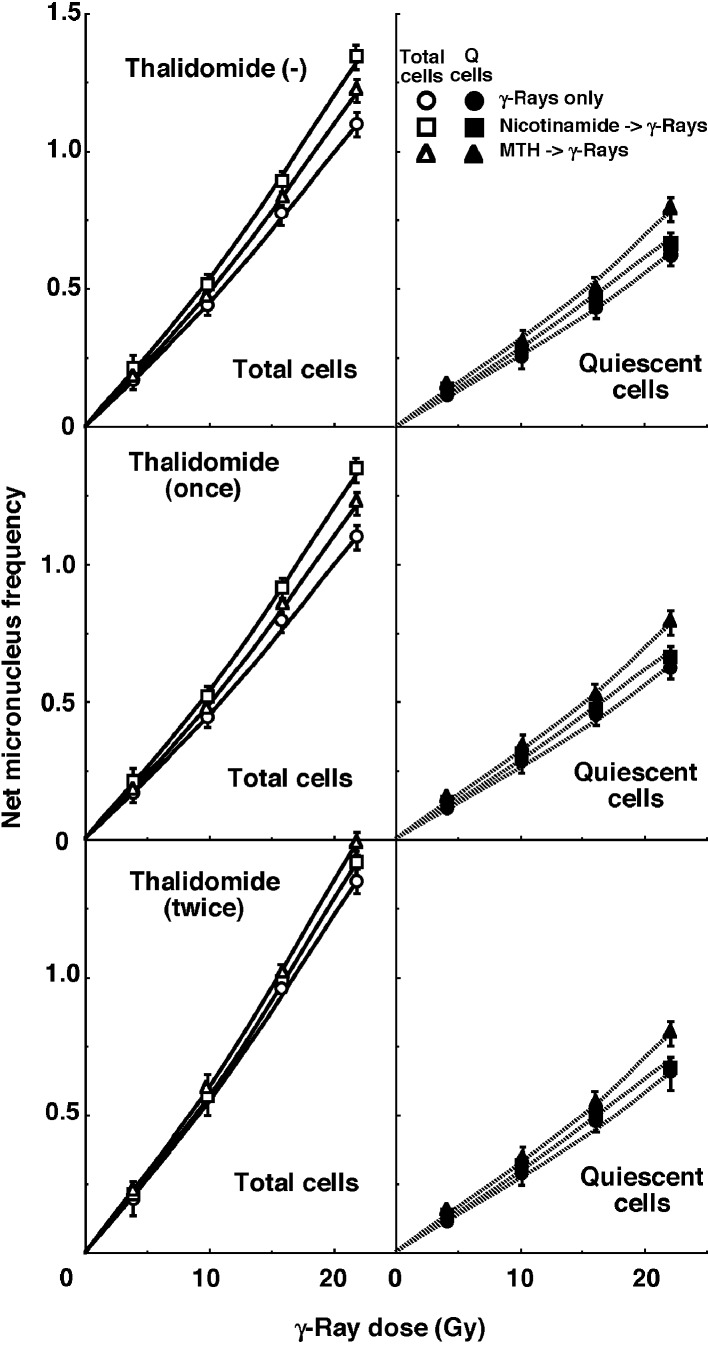
Figure 2.
Dose response curves of the net micronucleus frequency for total (open symbols: left panels) and quiescent (solid symbols: right panels) cell populations from B16-BL6 tumors irradiated with γ-rays following single or two intraperitoneal administrations of thalidomide in combination with nicotinamide treatment or mild temperature hyperthermia (MTH) on day 18 after tumor cell inoculation. Circles: γ-ray irradiation only; squares: γ-ray irradiation with nicotinamide treatment; triangles: γ-ray irradiation with MTH. Bars represent standard errors (n = 6).

