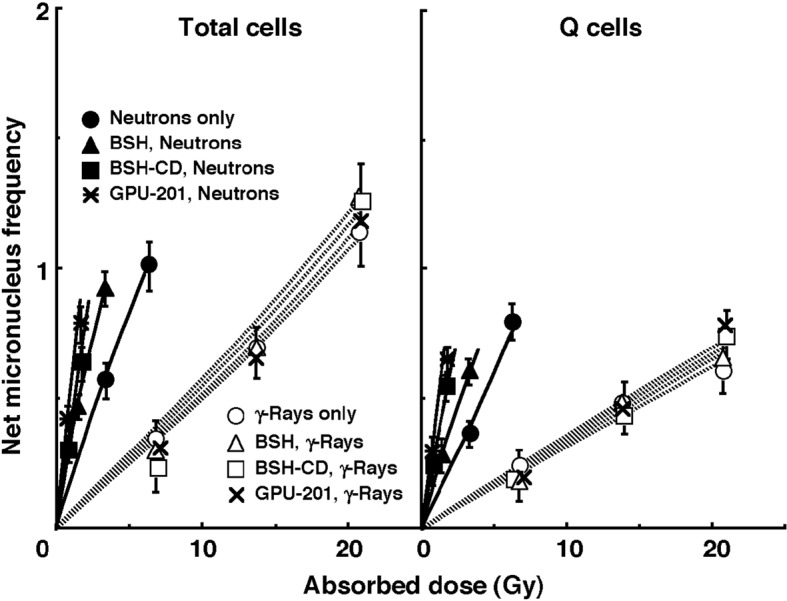
Figure 4.

Net micronucleus (MN) frequencies after irradiation in vivo using reactor neutron beams (•, ▲, ■, *) or γ-rays (○, △, □, x) following administration of 10B-carrier (GPU-201, BSH-CD or BSH) as a function of the physically absorbed radiation dose in total (left panel) and quiescent (Q, right panel) tumor cell populations. •, ○: without a 10B-carrier, ▲, △: with BSH, ■, □: with BSH-CD, *, x: with GPU-201. Bars represent standard errors (n = 9).
