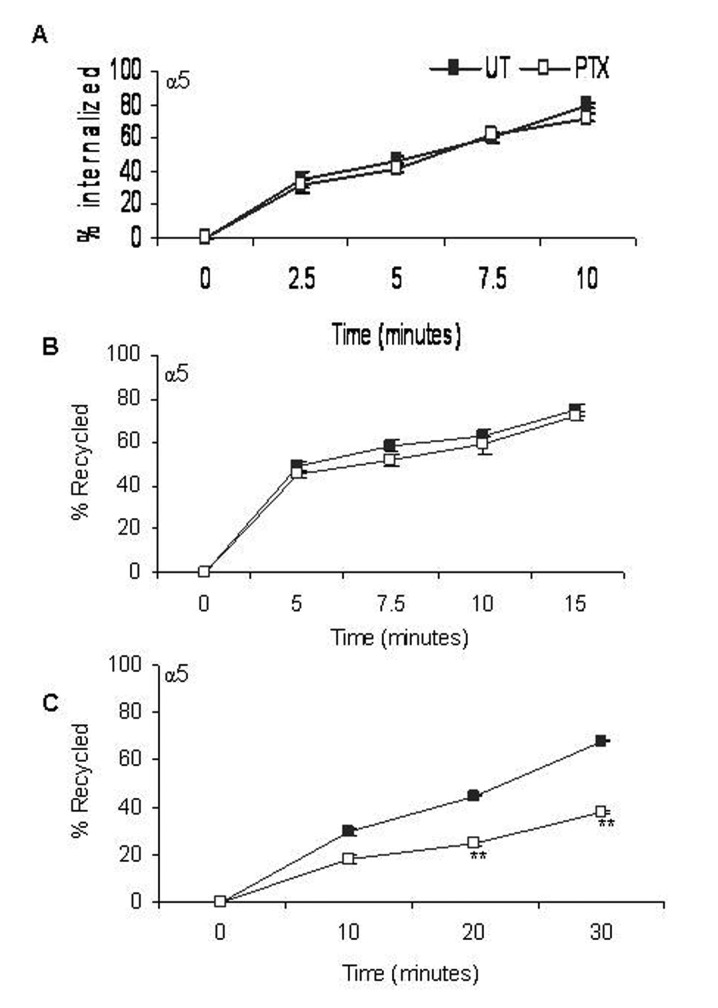
Figure 3.
Effect of PTX on rates of α5 integrin distribution /redistribution. Rates of internalization (A), recycling from early endosomes (B) and recycling from perinuclear endosomes (C) of α5 integrins were measured. Closed squares represent rates of integrin transport in untreated cells and open squares represent that of PTX treated cells. Results represent the mean ± s.e.m of three independent experiments. **P < 0.01 vs untreated control (Students t-test).

