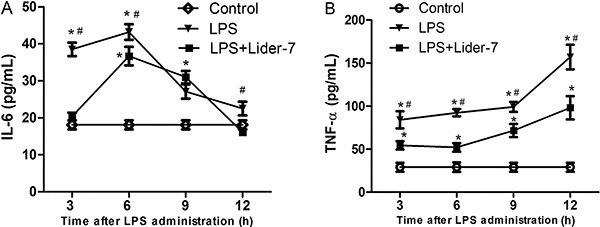
Figure 3. Changes in the levels of pro-inflammatory cytokines. A, Interleukin (IL-6); B, tumor necrosis factor (TNF α). Control group: n=5 for each time point; lipopolysaccharide (LPS) group: n=5 (3 and 6 h), n=4 (9 h) and n=3 (12 h); LPS+Lider-7 group: n=5 for each time point. Data are reported as means±SD. *P<0.05, LPS and LPS+Lider-7 groups compared to control group; #P<0.05, LPS group compared to LPS+Lider-7 group (ANOVA).

