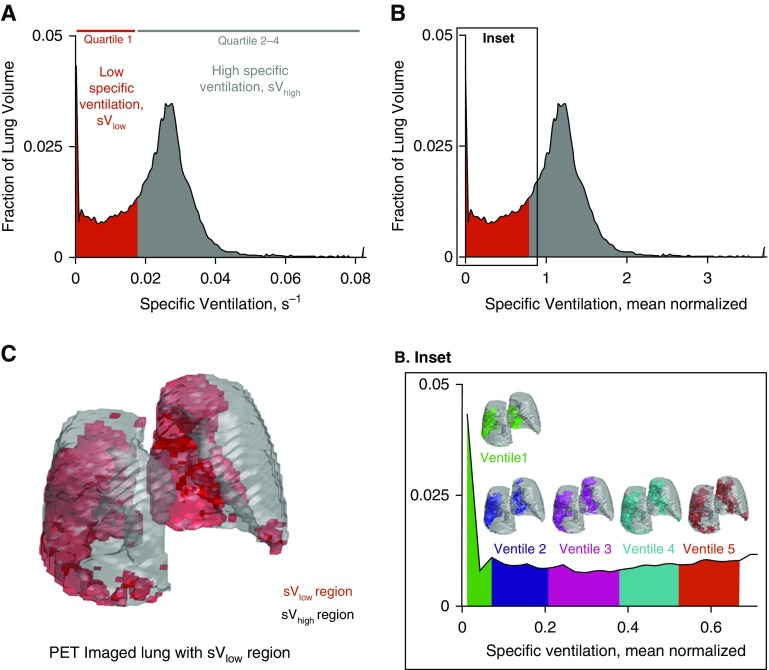
Figure 1.
Overview of key methods. (A) Histogram of postmethacholine specific ventilation (s−1) in subject 8. The red region represents the 25% of the lung with lowest specific ventilation (sVlow; quartile 1). Quartile 1 includes those specific ventilation values that make up the sVlow region. The gray region represents the specific ventilation values that make up the remaining lung region with high specific ventilation (sVhigh). (B) Histogram of mean normalized specific ventilation illustrating the mean normalization process when compared with A. The value 1 represents the mean specific ventilation in this subject. (Inset) For the subregion analysis, quartile 1, the sVlow region, was further subdivided into five ventiles, each representing 1/20th of the imaged lung volume. Here we illustrate how each ventile corresponds to the relative specific ventilation values on the histogram (zoomed in) and their spatial locations within the lung. Green = ventile 1, subregion with lowest specific ventilation; purple = ventile 2; pink = ventile 3; aqua = ventile 4; orange = ventile 5. (C) The spatial location of the sVlow and sVhigh lung regions in the imaged lung, illustrated in three dimensions. PET = positron emission tomography.

