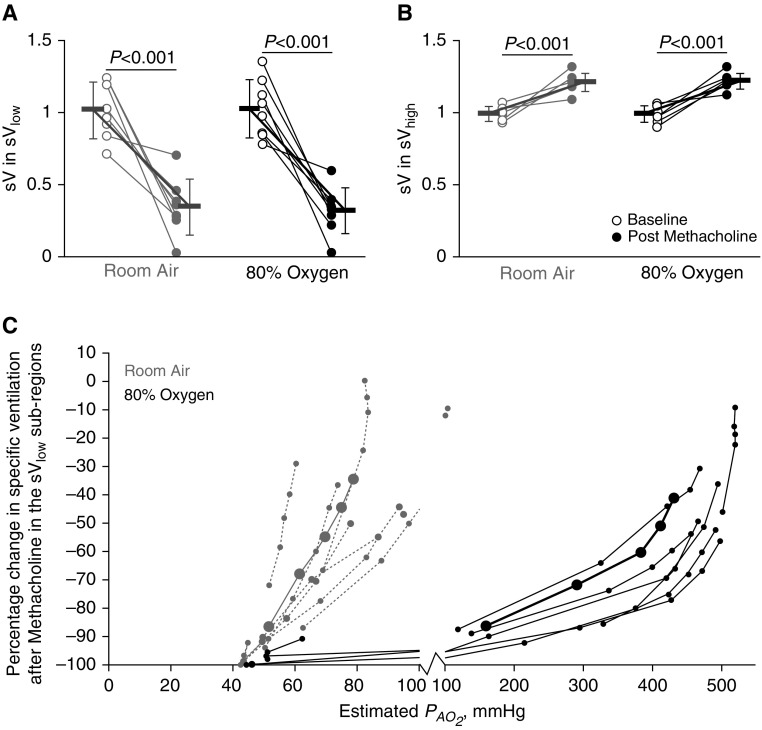
Figure 2.
Regional specific ventilation: effect of methacholine and 80% oxygen. Gray markers indicate room air conditions, and black indicates 80% oxygen. Open circles represent baseline data, and closed circles represent postmethacholine data. P values reflect the results from the pairwise comparisons. (A) The relative specific ventilation in the 25% of the lung with lowest specific ventilation, sVlow region, decreased significantly after methacholine under both room air and 80% oxygen conditions. (B) Relative specific ventilation in the remaining lung with high specific ventilation, sVhigh region, was significantly increased after methacholine under both room air and 80% oxygen conditions. (C) The percentage change in relative specific ventilation after methacholine within the sVlow subregions plotted against the predicted postmethacholine regional alveolar oxygen partial pressure (PaO2) are plotted in gray for room air conditions and in black for 80% oxygen conditions. In A and B, the bold lines with error bars represent mean and SD values within each subregion. In C, the bold black and solid gray lines with large closed circles represent mean values. Under room air conditions, the majority of subjects and subregions were hypoxic (PaO2 < 83 mm Hg). Under 80% oxygen conditions, the lowest-ventilating subregions in four of eight subjects had a PaO2 less than 83 mm Hg. sV = relative specific ventilation.

