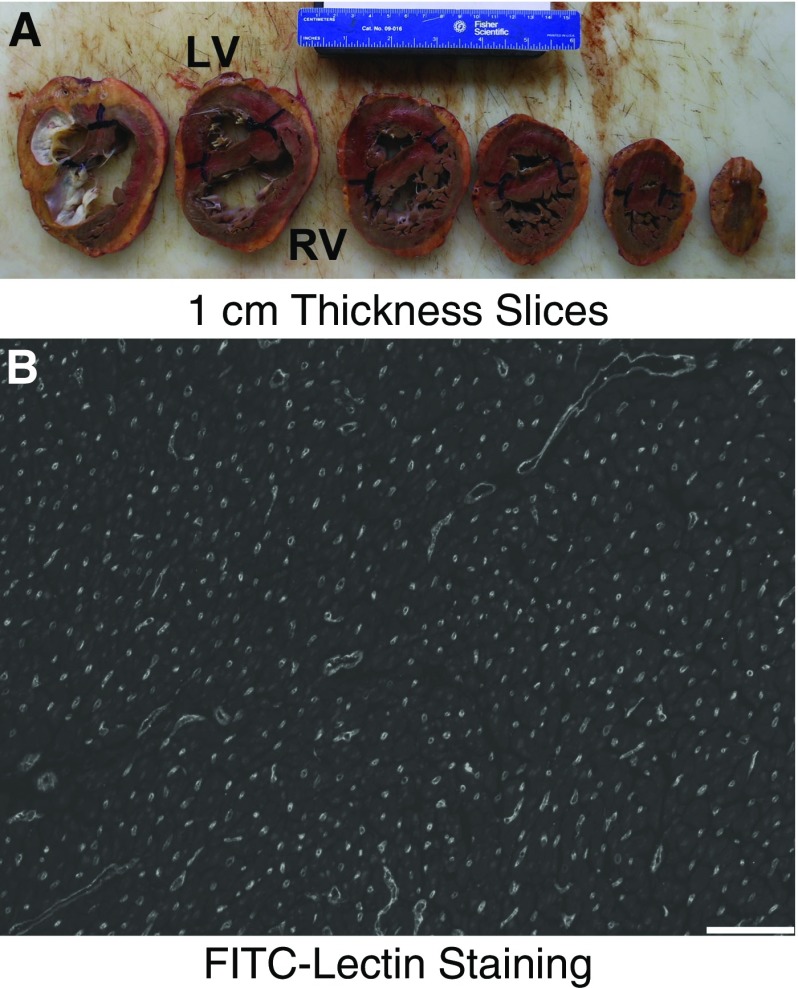
Figure 1.
Stereologic approach for analysis of right ventricle (RV) vasculature. (A) The ventricles are sectioned at 1-cm thickness with a random start. (B) Uniform, random, isotropically oriented sections are stained with fluorescein isothiocyanate–lectin (FITC-Lectin) (scale bar: 100 μm). LV = left ventricle.

