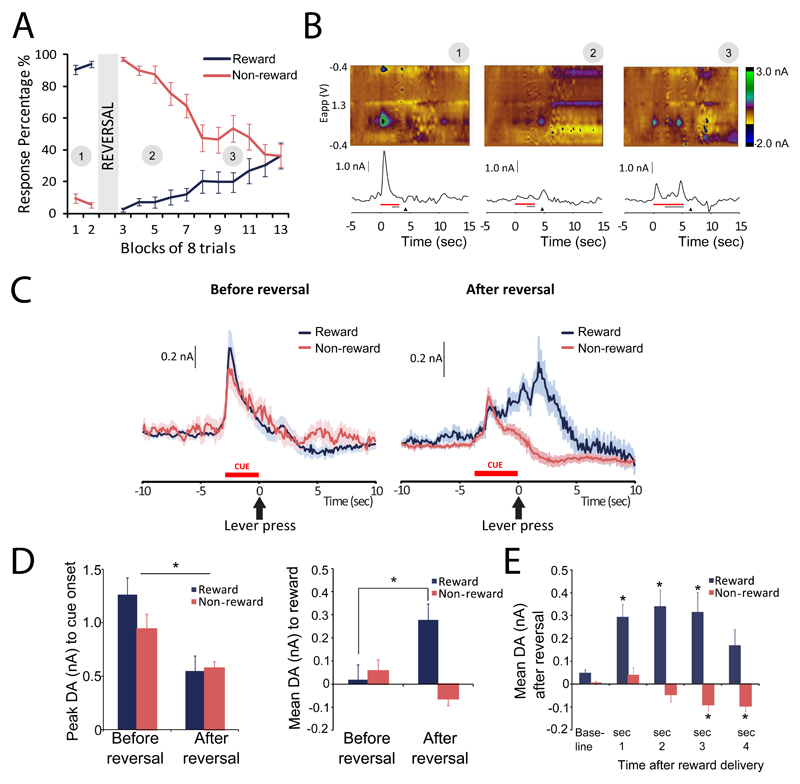
Figure 2. Phasic DA release in the ventromedial striatum during reversal learning (n=21).
A. Behavioral performance across reversal learning session. Lines show percent response during rewarded (blue) and non-rewarded (red) trials across consecutive blocks of trials before and after reversal (block 3). Numbers in grey circles correspond to examples of individual trials in panel 2B. B. Examples of individual trials. Red bar indicates presentation of cue lights, grey bar the presentation of levers and black triangle time of reward collection. Left – before reversal, cue presentation evokes DA release in ventromedial striatum, middle – after reversal, cue-evoked DA is diminished and reward delivery evokes DA release, right – after several correct trials, cue-evoked DA is reinstated. C. Fluctuations in striatal DA averaged over trials. Left - before presentation of reversal, cue presentation evokes DA response in ventromedial striatum in both rewarded and non-rewarded trials. Right - after presentation of reversal, cue-evoked DA release is still apparent, but followed by an additional, gradual increase in DA release, in rewarded, but not in non-rewarded trials. Blue lines – mean rewarded trials, red lines – mean non-rewarded trials, shaded regions – SEM. D. Quantification of DA release to cue presentation and reward delivery. Left – cue-evoked DA release is lower after presentation of reversal. Right – reward delivery evokes DA release after reversal presentation. E. Bidirectional DA signal on rewarded and non-rewarded trials. After reversal, increased striatal DA is observed following reward delivery. In non-rewarded trials, DA decreases below baseline.

