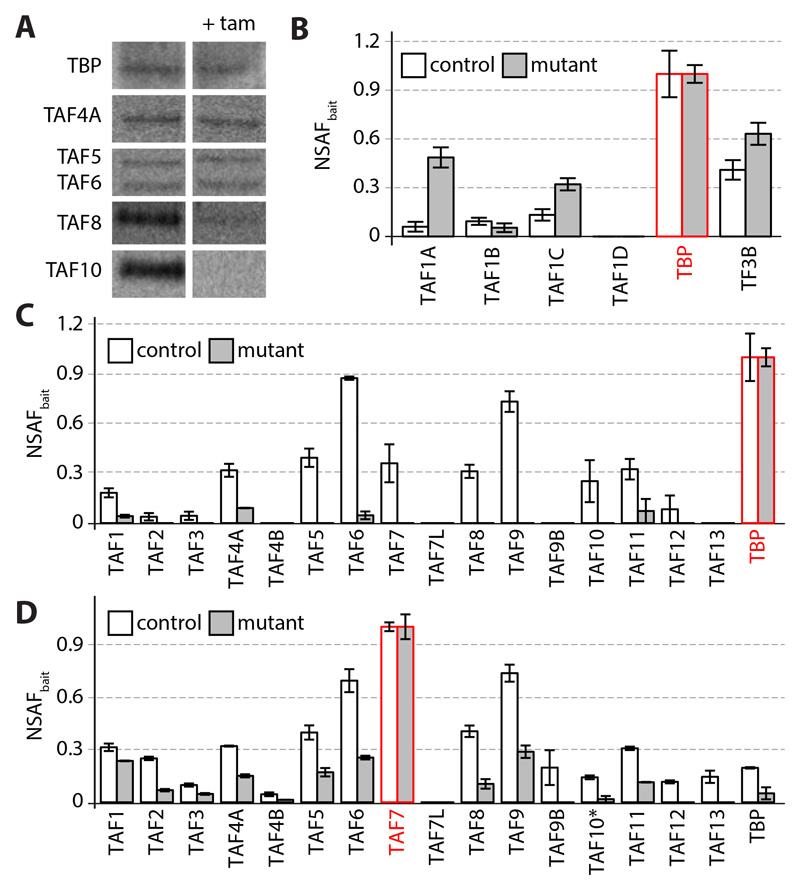
Fig. 2. TFIID assembly defect in R26Cre;Taf10 mutant embryos.
(A) Western blot analysis of the expression of TBP, TAF4A, TAF5, TAF6, TAF8 and TAF10 from whole cell extracts of E9.5 R26Cre;Taf10 control (left, untreated) or mutant (right, treated with tamoxifen at E7.5) embryos. (B) TBP NSAFbait values for SL1 complex subunits (TAF1A, TAF1B, TAF1C, TAF1D and TBP) and TF3B-TBP complex. (C-D) NSAFbait values for TFIID subunits of TBP-IP (C) and TAF7-IP (D). Bait proteins are indicated in red. Control and mutant IPs are indicated in white and grey, respectively. TAF10* corresponds to the full-length TAF10 protein. tam; tamoxifen. Error bars indicate standard deviation, n=3.

