Figure 1.

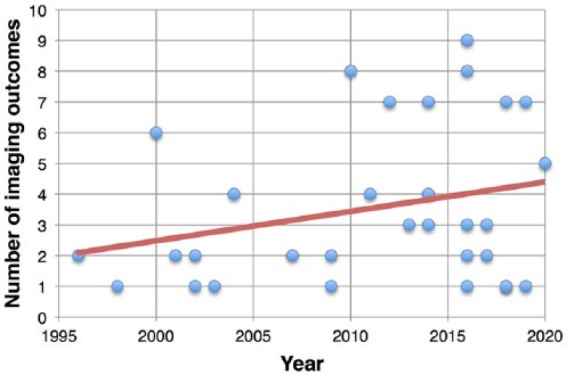
Clinical trials and imaging outcomes. Scatter plot shows the number of imaging outcomes used in clinical trials conducted from 1996 up to recent years (the expected conclusion date has been used for ongoing clinical trials).

Clinical trials and imaging outcomes. Scatter plot shows the number of imaging outcomes used in clinical trials conducted from 1996 up to recent years (the expected conclusion date has been used for ongoing clinical trials).