
Figure 3.
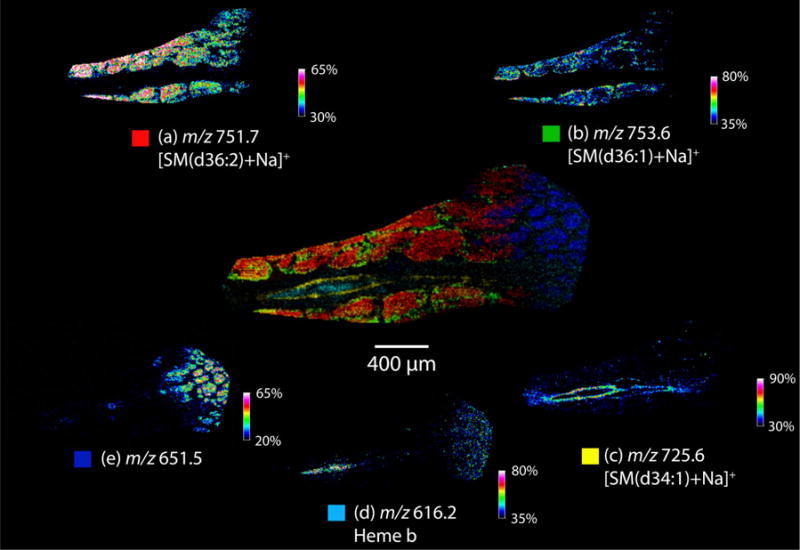
Positive ion mode lipid analysis of a sagittal section of human optic nerve tissue. Ion images display the distributions of (a) SM(d36:2), (M+Na)+, (b) SM(d36:1), (M+Na)+, (c) SM(d34:1), (M+Na)+, (d) Heme b, (e) unidentified m/z 651.5. The central image in each panel is an overlay of the individual ion maps shown