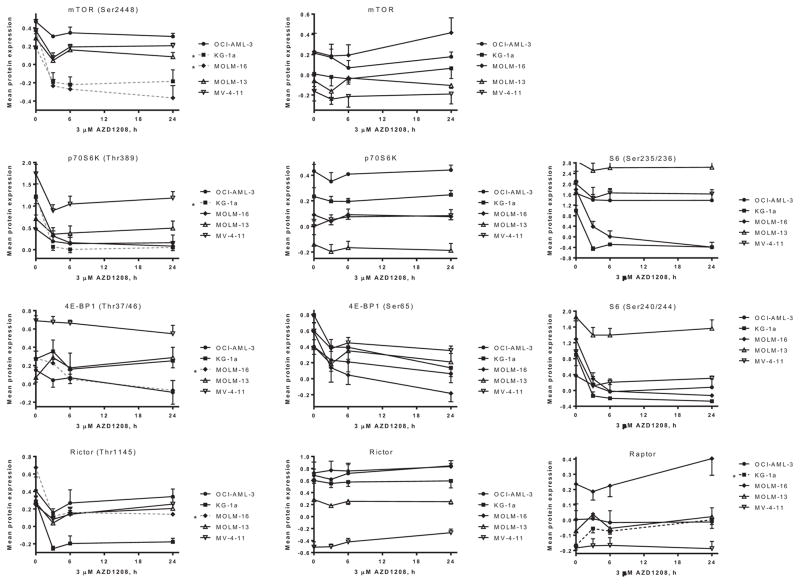
Figure 3. RPPA: Suppression of mTOR signaling in five AML cell lines.
Graphical representation of relative log2-transformed protein levels normalized by median-centering. The results represent the average level of triplicate experiments ± SEM of proteins where changes determined to be statistically significant.

