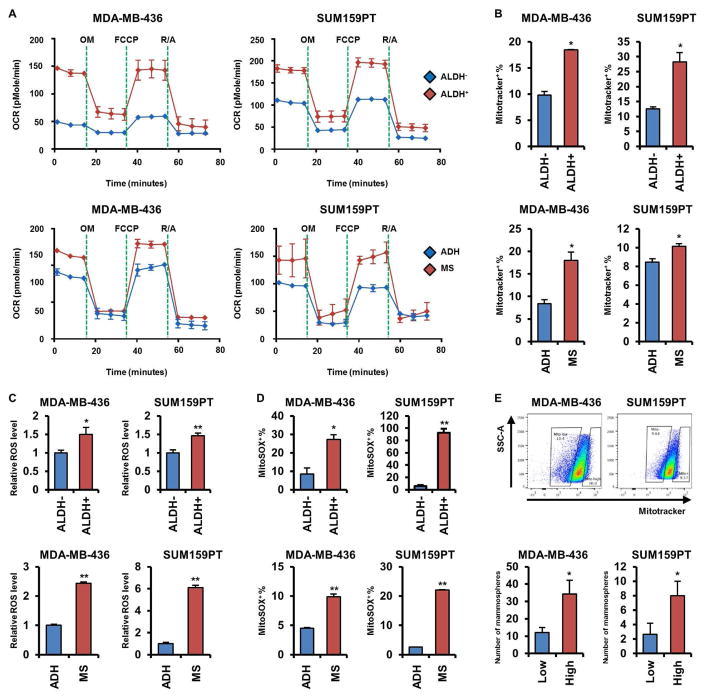
Figure 3. Breast CSCs exhibit an enhanced mitochondrial respiratory phenotype.
(A) OCRs were determined in cells sorted by ALDH activity (upper panel) or grown as mammospheres or in adherent condition (lower panel). (B) MDA-MB-436 and SUM159PT cells sorted or grown as in A were stained with Mitotracekr Red CMXRos and then analyzed by flow cytometry (*p<0.005). (C) ROS levels were determined by ROS-Glo as described in Experimental Procedures (*p<0.05, **p<0.005). (D) Cells were stained with MitoSOX Red and analyzed by flow cytometry (*p<0.005, **p<0.0005). (E) Cells were sorted by flow cytometry upon intensity of Mitotracker Red CMXRos (upper) and then seeded in mammosphere assays for 7 days (* p<0.05). Data are represented as mean ± SD.

