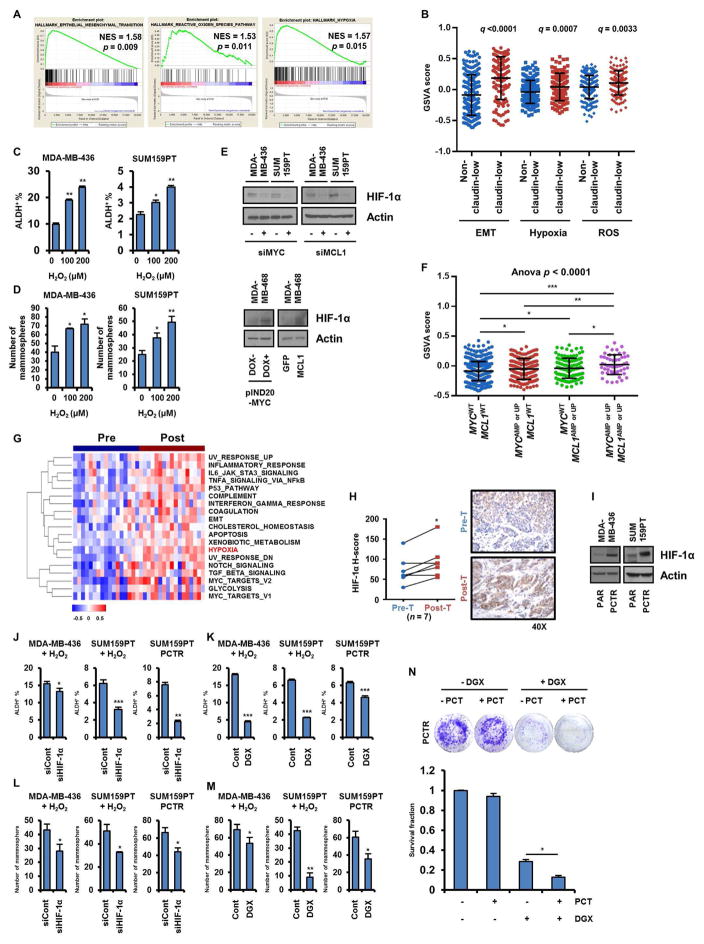
Figure 7. Enrichment of CSCs driven by MYC and MCL1 is mediated by ROS-induced HIF-1α stabilization.
(A) mRNA expression data of TNBC cell lines (n=20) in the CCLE was analyzed using GSEA. Plots indicate hallmark gene sets enriched in claudin-low TNBC cell lines. (B) TNBCs in the METABRIC database (n=320) were divided as claudin-low and non-claudin low based on PAM50 analysis. GSVA scores were plotted accordingly. (C, D) Cells treated with H2O2 for 4 days were subjected to ALDH assay (C, *p<0.005, **p<0.0005) or seeded in mammosphere assays for 7 days (D, *p<0.05, **p<0.005). (E, I) Lysates were subjected to immunoblot analysis with HIF-1α and actin antibodies. (F) GSVA scores were generated with a gene set (Hallmark_Hypoxia) in TCGA breast tumors (*p<0.05, **p<0.005, ***p<0.0005). (G) Hallmark gene sets enriched in TNBCs after chemotherapy were determined using GSVA. Heatmap shows significantly enriched gene sets (q<0.05). (H) IHC analysis of HIF-1α in FFPE sections from TNBC biopsies before and after chemotherapy (n = 7; paired t tests, *p<0.05). (J, K) Cells were transduced with HIF1A siRNA (J, left and middle panels) or treated with 50 nM digoxin (K, left and middle panels) in presence of 200 μM H2O2 for 4 days. Cells were then subjected to ALDH assay (*p<0.05, **p<0.005, ***p<0.0005). (L, M) Cells manipulated as in J and K were seeded in mammosphere assays for 7 days (*p<0.05, **p<0.0005). (N) PCTR SUM159PT cells were treated with 50 nM paclitaxel ± 100 nM digoxin for 10 days (*p<0.0005). Data are represented as mean ± SD.

