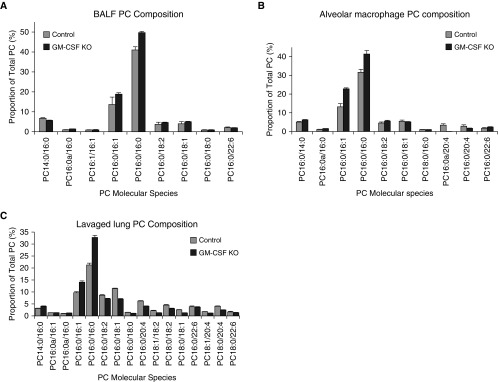
Figure 2.
PC molecular species compositions in lung compartments. (A) Proportional representation of all PC species > 0.5% total PC in lavaged lung tissue from control and GM-CSF KO animals (mean ± SEM, n = 12 and 24). (B) Proportional representation of all PC species > 0.5% total PC in BALF from control and GM-CSF KO animals (mean ± SEM, n = 9 and 19). (C) Proportional representation of all PC species > 0.5% total PC in cells recovered from control and GM-CSF BALF (mean ± SEM, n = 11 and 14). The reported molecular species represent the experimentally ascertained dominant molecular species from the potential isobaric options.

