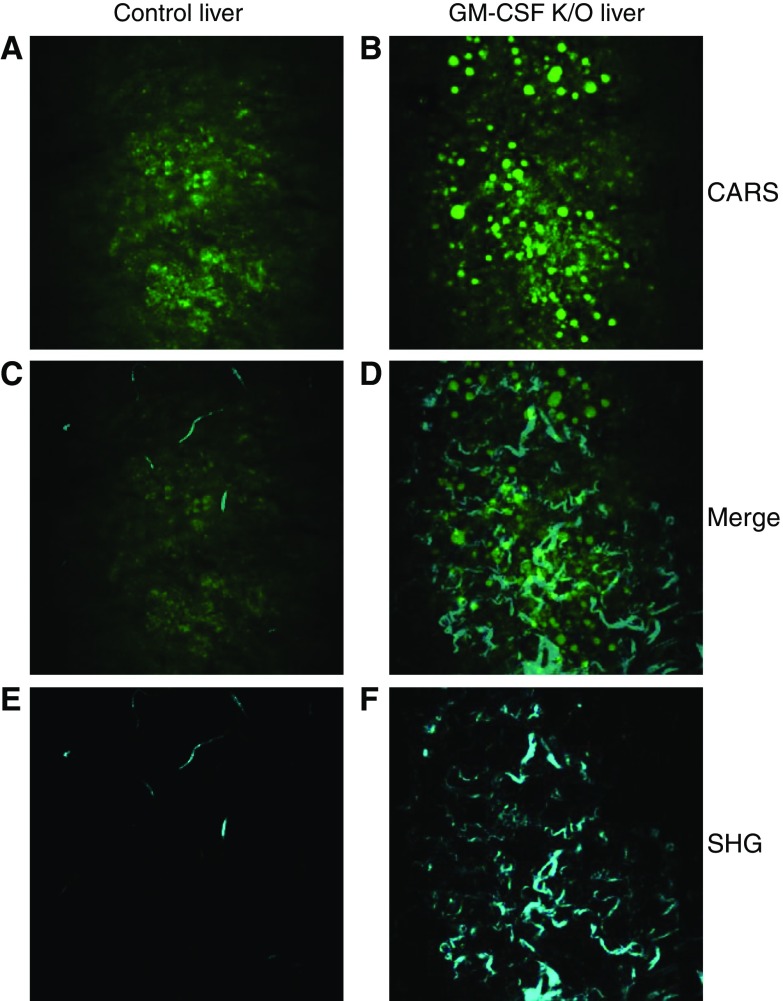
Figure 6.
CARS and SHG of liver sections. Livers from control and GM-CSF KO animals were subjected to CARS and SHG microscopy. A and B show CARS images which confirm significant increases in number and size of lipid droplets present in GM-CSF livers. C and D show the respective overlays of images A with E, and B with F and define the spatial relationships between lipid accretion and hepatic fibrotic changes. E and F show the SHG images of the same areas which show a pattern of significantly increased collagen fiber depositions in the GM-CSF KO livers.

