Figure 7.
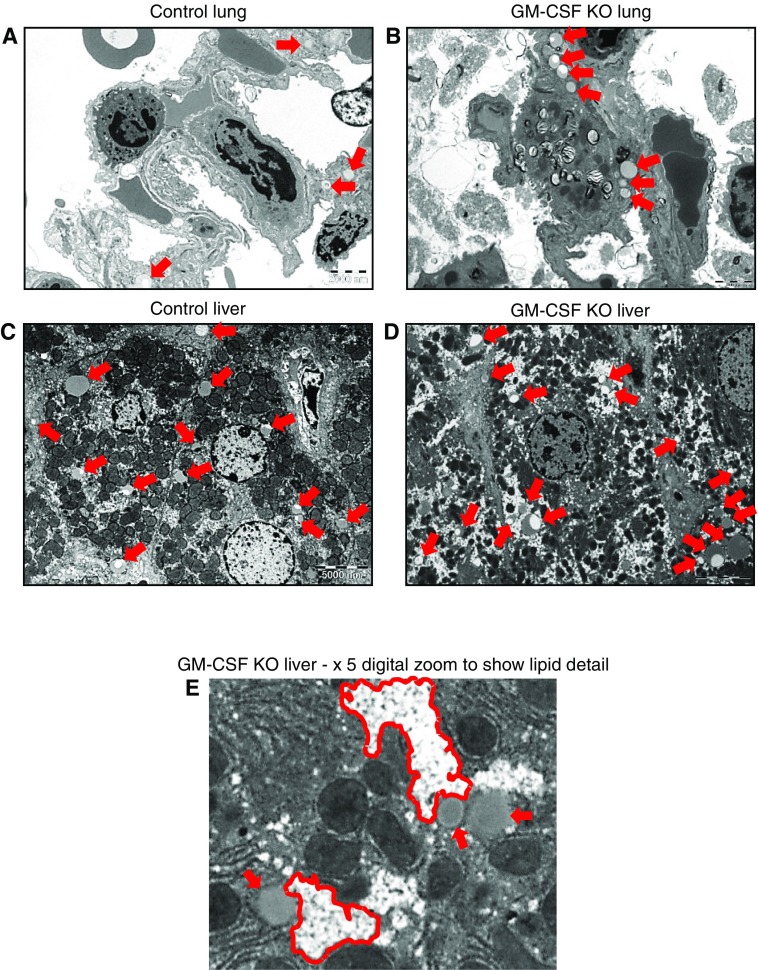
Transmission electron microscopy (TEM) of lung and liver tissues. Unlavaged lungs and livers from control and GM-CSF KO animals were subjected to TEM. For control lungs, 12 distinct image fields were collected and analyzed from three grids. For GM-CSF KO lungs, 17 distinct image fields were collected and analyzed from four grids. For control livers, 9 distinct image fields were collected and analyzed from 3 grids. For GM-CSF KO livers 12 distinct image fields were collected and analyzed from 4 grids. Scale bars are 2,000 nm and 5,000 nm for lung tissue and liver tissue, respectively. (A) Control lung: representative image showing a few sporadic lipid droplets (indicated by red arrows) but no consistent pattern. (B) Representative image showing accumulations of lipid droplets largely confined to lipofibroblast cells, with no indication of involvement of the adjacent AT2 or AT1 cells. A larger version of B is presented in Figure E5, which shows more detailed labeling of cells and lipid contents. (C) Control liver: representative image showing the presence of a number of lipid droplets (red arrows), some of which consist of nascent lipoproteins and others that are more likely lipid stores. (D) GM-CSF KO liver, representative image showing a much wider range of lipid droplets (red arrows), which in addition to lipoproteins reveal, when zoomed in upon in E, clusters of very small droplets (outlined in red) alongside larger droplets bounded by lipid bilayers.

