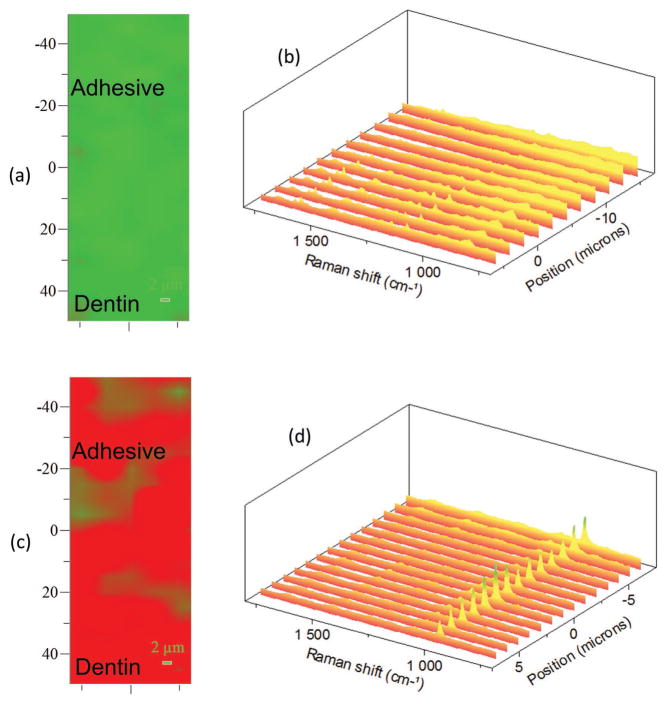
Figure 3.
a) Representative Raman XY imaging and b) the spectral analysis of the a/d interface following the additional etch. c) Raman XY imaging and d) the spectral analysis of the a/d interface after remineralization. The spectral features associated the mineral (PO4−2 at 962 cm−1) show up after the remineralization following the addition etch.

