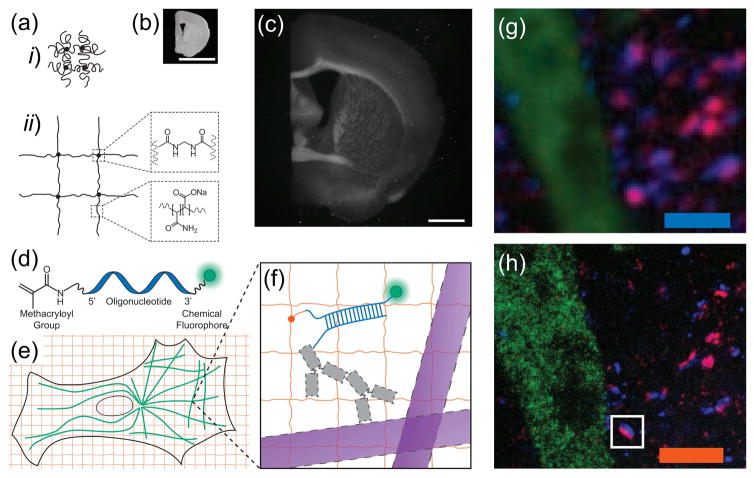
Figure 1. The ExMM Concept.
(a) Schematic of (i) collapsed polyelectrolyte network, showing crosslinker (dot) and polymerchain (line), and (ii) expanded network after H2O dialysis. (b) Photograph of fixed mouse brain slice. (c) Photograph, post-ExM, of the sample (b) under side illumination. (d) Schematic of label that can be anchored to the gel at site of a biomolecule. (e) Schematic of microtubules (green) and polymer network (orange). (f) The label of (d), hybridized to the oligo-bearing secondary antibody top (top gray shape) bound via the primary (bottom gray shape) to microtubules (purple), is incorporated into the gel (orange lines) via the methacryloyl group (orange dot) and remains after proteolysis (dotted lines). Scale bars, (b) and (c) 5 mm. Schematics are not to scale. (g) Confocal fluorescence images of a Thy1-YFP mouse brain slice, stained with presynaptic (anti-Bassoon, blue) and postsynaptic (anti-Homer1, red) markers, in addition to antibody to GFP (green), (g) pre- versus (h) post-expansion. Scale bars (g) 2.5 μm; (h) 2.5 μm. Adapted with permission from Ref. [11].

