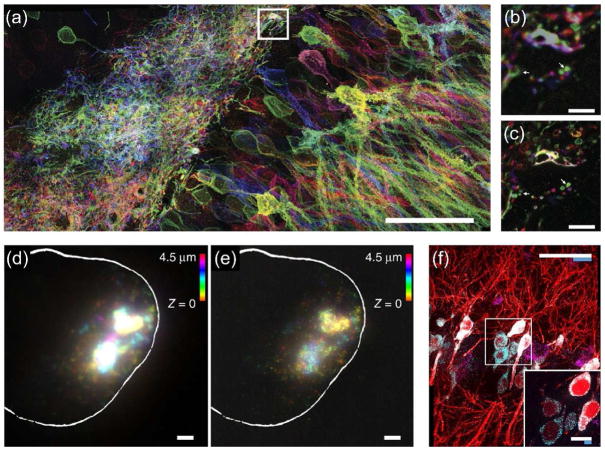
Figure 2. The concepts of proExM and ExFISH/smFISH.
(a) Maximum intensity projection of high-resolution confocal microscopy stack following expansion of neurons expressing Brainbow3.0. (b) Pre-expansion confocal image showing one optical section of the boxed region in f. (c) Post-expansion image of b. Scale bars: (a) 5 μm, (b) 5 μm, (c) 50 μm. Adapted with permission from Ref. [13]. (d) smFISH image of X-inactive specific transcript (XIST) long non-coding RNA (lncRNA) in the nucleus of an HEK293 cell before expansion (white line denotes nuclear envelope in d–e). (e) As in f, using ExFISH. (f) Confocal image of mouse hippocampal tissue, showing single RNA puncta. Inset, one plane of the boxed region (red, YFP protein; cyan, YFP mRNA; magenta, Gad1 mRNA). Scale bars: (d) 2 μm, (e) 2 μm, (c) 50 μm, inset 10 μm. Adapted with permission from Ref. [12].

