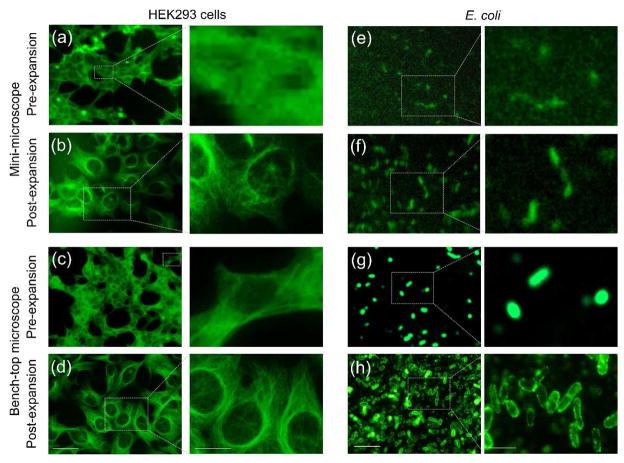
Figure 4. The concept of ExMM.
(a–d) ExMM imaging of tubulin for HEK293 cells. (a, b) Pre- and post-expansion images obtained from mini-microscope. (c, d) Pre- and post-expansion images obtained from bench-top microscope. Scale bars: (left) 100 μm; (right) 50 μm. (e–h) ExMM imaging of E. coli. (e, f) Pre- and post-expansion images obtained from mini-microscope. (g, h) Pre- and post-expansion images obtained from bench-top microscope. Scale bars: (left) 5 μm; (right) 2 μm. Adapted with permission from Ref. [14].

