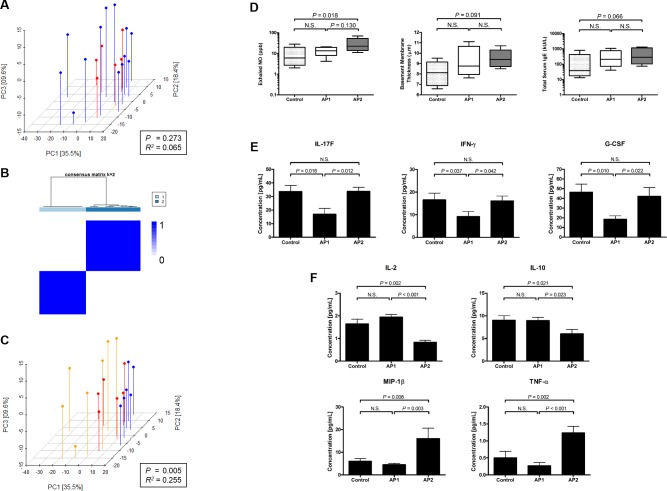
Fig 1. Cytokines and chemokines identify unique asthmatic phenotypes which are distinct from controls.
(A) Principal coordinate analysis of 24 cytokines and chemokines measured in bronchoalveolar lavage (BAL) between control subjects (red) and asthmatics (blue). (B) Optimal clustering solution (k = 2) shown with heatmap of consensus indices (Legend: 1 = dark blue, 0 = white). (C) Asthmatics were reclassified based on their phenotype, as determined by unsupervised clustering: control (red), asthmatic phenotype (AP)1 (blue), and AP2 (orange). Significance of grouping was determined by PERMANOVA: P < 0.05 was considered significant and R2 is goodness of fit. (D) Clinical markers, exhaled NO (left), bronchial basement membrane thickness (middle), and total serum IgE (right), of asthma severity between controls, AP1, and AP2. Boxplot represent the median and quartiles. Exhaled NO and total serum IgE were log10 transformed for normalization. Significance determined by one-way ANOVA and Tukey’s post-hoc t-test, P < 0.05 was considered significant. BAL cytokines and chemokines were compared between controls and asthmatic phenotypes by pair-wise comparisons using limma. Cytokines and chemokines are shown that were found to be significantly (P < 0.05, Q < 0.1) enriched or depleted in (E) AP1 and (F) AP2. Each group is represented as mean and error bars are standard error of mean.

